
Vol. 25, No. 4
Executive Summary
There is information being produced in Wisconsin today that can inform teachers, principals and the public on the impact individual schools are having on student achievement. More importantly, there is information available that teachers and principals could use to evaluate the effectiveness of instructional approaches. Despite its availability, the vast majority of Wisconsin school districts are not using this information in a meaningful fashion.
The report that follows recommends that value-added analyses of student test scores being conducted by Wisconsin’s own Value-Added Research Center be given to the principal and teacher of every publicly funded K-12 pupil in Wisconsin. Value-added analysis is a method of understanding how much a student’s achievement has grown during a school year. It is not a test that students take, but rather, it is a method of analyzing the results of standardized assessments to help separate out the contribution of the school—or, depending on the specification of the model, the teacher—to the student’s progress. Unlike a raw test score, a value-added analysis can isolate the real impact a school and/or teacher is having on academic achievement. In the right hands, this information can be a powerful tool that teachers and schools can use to make educational decisions that benefit students.
Lost in much of the debate over standardized assessment in Wisconsin is a discussion of how test scores should best be used. While transparency to the public is necessary, data should first and foremost be used to aid student instruction. A review of the history of assessment policies in Wisconsin demonstrates that the effective use of test score data has been undermined by all-too-frequent changes in our state’s assessment policies.
However, as Wisconsin moves on from the era of No Child Left Behind, there is an opportunity to leverage existing tests and expertise to provide schools and teachers with quality information on the impact they are having on student learning. With such information, the effectiveness of important factors such as curricula and teaching strategies can be evaluated and modified as needed.
After a thorough review of the current and historical context of Wisconsin testing policies as well as an overview of the potential and logistics of introducing a statewide value-added assessment system, several specific strategies are proposed:
- Adding value-added data to statutorily required school and district performance reports (or the next generation accountability system currently being devised);
- Requiring that all teachers and principals receive a value-added analysis of their students’ state standardized test scores;
- Ensuring that teachers and principals know how to use value-added analysis by providing training as well as encouraging the teaching of value-added methodology at Wisconsin schools of education;
- Including all publicly funded pupils in a state value-added system.
While there are moderate costs to getting the most out of value-added analysis, there is vast potential to use existing federal and state funding as well as private philanthropy to offset these costs.
After decades of testing pupils in Wisconsin, it is time to ensure that useful data reach those most important in determining student success. The statewide, uniform use of value-added analyses already being done in Wisconsin is a step toward giving teachers and principals additional tools to meet the needs of Wisconsin pupils.
Introduction
Over the past three decades, publicly available achievement data on Wisconsin pupils have proliferated. While these data do not educate a single child, they can be powerful tools to aid the people who do. Yet, most policymakers and educators are just beginning to understand how and why this information should be used.
This report proposes the use of value-added analysis of Wisconsin K-12 test scores to understand how students are doing, and, more importantly, how schools and teachers are affecting how students are doing. Specifically, the use of a statistical technique called value-added analysis is recommended.
A crucial first step to understanding the logic of value-added methodology is to understand the limitations of student test score data. The results of Wisconsin standardized tests, for example, yield information only on how much a student knows in a specific content area. While it may be tempting to draw conclusions about the quality of a teacher or a school based on student test scores, such an inference is often uninformed. Or, more precisely, test scores provide an imprecise way to evaluate the quality of teaching. A test score does not reveal how much a student knew when he or she arrived in a given classroom, nor does it account for socioeconomic factors known to impact student achievement. Value-added analysis, however, does.
Value-added is not a type of test but a methodology with the potential to help test score data be used to positively impact student achievement.
How can it do this?
First, it isolates the specific impact of a school or teacher on student test scores. It does this by accounting for factors outside the classroom, such as poverty and prior performance—factors that are known to impact student achievement but that a school or teacher has no power to change. Second, value-added analysis also allows schools to track individual student growth over time.
The ability to isolate the impact of a school or teacher on performance as well as track that performance over time ensures that staffing and instructional decisions are not being based on factors over which teachers have no control. For example, it makes little sense to reassign or criticize a teacher for low student tests scores if those scores are attributable to factors totally unrelated to teacher performance.
And it is not just about teacher performance. Value-added analysis also allows specific curriculum, learning environments and instructional approaches to be more fairly assessed at the school or classroom level. Unfortunately, the recent use of value-added data to publicly rank public school teacher performance in New York and Los Angeles has led some to conclude that the methodology is nothing more than a vehicle for publicly shaming teachers.1 Using value-added simply to rank schools and teachers misses the point; the methodology can and should be a tool that empowers educators and principals to make decisions in the best interest of student learning.
Say, for example, a principal receives value-added analyses indicating which teachers are having the most impact on gains in student test scores. With that information, school and district leaders can investigate further: What is this teacher doing that is different from the other teachers? Can these instructional strategies be shared with other teachers to increase the overall level of student success in the school? Can teachers be placed in environments where they are more likely to be successful with students? Even at the state level, knowing how Wisconsin students stack up to students around the country and around the world can help stakeholders understand what schools are doing right and what can be improved upon with the overarching goal of improving student outcomes.
In order for school districts to maximize the impact of data, they must first have the data and second, know how to use the data to assess and improve classroom instruction. Wisconsin is particularly well-positioned to maximize the impact of value-added analysis because the Value-Added Research Center (VARC) is housed at the University of Wisconsin-Madison. VARC is a national leader in conducting value-added analysis and currently contracts with some of the largest school districts in the nation to assess and improve their performance. VARC also works with individual Wisconsin school districts on specific projects. Fortunately, VARC produces value-added information for all Wisconsin school districts. Unfortunately, only 46 (out of 426) school districts have thus far chosen to receive the information generated by VARC.
In recent years, the discussion around standardized testing has focused on what tests are used rather than the way in which testing information is used. This report will review the history of standardized testing policies in Wisconsin and conclude that frequent changes to testing policies have undermined the ability of admittedly flawed testing instruments to be used to their full potential.
A review of the history of student assessment in Wisconsin reveals that the development of new assessment systems has repeatedly been dominated by politics, bureaucracy and an emphasis on process and consensus instead of on results. It is essential that Wisconsin does not repeat past mistakes by replacing the lame-duck Wisconsin Knowledge and Concepts Exam (WKCE) with new assessment policies that deliver limited useful information to teachers, parents and school leaders.
This report includes a review of the mistakes of the past, establishes specific goals for a modern student-assessment system, and recommends the use of value-added analysis as part of a comprehensive strategy for schools and districts to use achievement results to improve the overall quality of K-12 education in Wisconsin.
History of Wisconsin Testing Policy
In most ways, the evolution of testing in Wisconsin mirrored that of other states until 2001, when the federal government asserted itself into educational assessment. The federal No Child Left Behind (NCLB) Act of 2001 was a watershed. Not only did NCLB give the federal government a substantial role in state education policy, it allowed the states to set comparatively low testing standards.
The development and implementation of Wisconsin assessment policies fit loosely into four time periods. All of these time periods share certain common characteristics. Most notably all ended with substantial changes to the state standardized test. The four eras are:
- The era of local control: 1845-1989
- The era of state control: 1990-2000
- The era of federal control: 2001-’09
- The era of multi-state cooperation: 2010-present
Local Control
The first Wisconsin public school opened in what is today Racine in 1845.2 While the state constitution requires that students have access to a fair and equitable education, it was local interests that overwhelmingly determined the method by which local children were educated until almost 1990. In this era, most districts chose simply not to use standardized tests; those that did generally did so primarily for classroom use by teachers, not to provide information to parents or the community.
It was not until 1975 that the Department of Public Instruction (DPI) began using standardized testing to fulfill its statutory requirement to “Develop an educational assessment program to measure objectively the adequacy and efficiency of educational programs offered by public schools in the state.”3 That year, samples of pupils from across the state were given the DPI-developed Wisconsin Pupil Assessment and/or the commercially produced Comprehensive Tests of Basic Skills. However, school districts had the option to administer tests of their own choosing and to score them as they saw fit.
In 1981 DPI, under the direction of then-State Superintendent Barbara Thompson, released a document titled Local Option Testing Manual. The manual encouraged the use of subjective standards, discouraged continuity, and emphasized consensus and process in the development of district-level assessment policies.4 The manual is evidence that many of the questions during recent debates on Wisconsin assessment policy, such as what standards and what specific test should be used, have been asked before.
The report suggested that testing relative to objective standards is difficult:
“At the outset, it needs to be emphasized that there is no generally accepted procedure which allows one to set performance standards with ease.”
This, of course, makes it much less likely that districts will find a method of setting rigorous standards. Further, the report, when listing possible ways to set performance standards, accepted that some schools may choose to set standards after test results are returned:
“Some schools may choose to set performance standards after they have received test results for their students, basing the standards on the average scores and additional information about students performance.”
Knowing what we know today, discouraging the testing of students against objective standards and setting standards in reaction to student performance undermine the logic and usefulness of standardized testing. While this mindset may be partially attributed to a time where the power of testing was yet unknown, the two themes are prevalent throughout the history of testing in Wisconsin.
Wisconsin, like other states, suffers from a lack of testing continuity that makes accurate longitudinal analysis of student test scores impossible. The Local Option Testing Manual actually encouraged the changing of standards by which to be measured, stating:
“The process of setting performance is not something which is done once and then forgotten. Periodically, standards should be reviewed and adjusted.”
Reviewing and periodically changing standards appears sensible on the surface (and at times is), but doing so frequently undermines the ability to test student performance over time, particularly in core subjects such as reading and math.
Through the 1980s, local control of testing gradually was replaced by an increased role for DPI. The 1983 publication of the widely critical federal report on the nation’s education system, A Nation At Risk, led to a national push for more rigorous testing of K-12 students across the country. In 1984, Wisconsin began requiring all districts to administer standardized tests for the first time. All students were given tests in reading, language arts and mathematics at least once in grades K-5, 6-8 and 9-12. The Competency-Based Testing Program (CBTP) was the official state test, though it remained voluntary. Districts were permitted to develop and use their own tests with DPI approval, or to create a test drawing from a set of questions developed by DPI.
The push for more testing in response to A Nation At Risk continued throughout the decade. In 1988, the Legislature established the Wisconsin Achievement Test, which was given in addition to the CBTP in reading, language arts and math. However under state statute 121.02(1)(s) districts that used CBTP were not required to give the Wisconsin Achievement Test. The first specific test in Wisconsin required of all school districts was the Wisconsin Reading and Comprehension Test, also known as the third-grade reading test. Made a requirement in 1988, it was intended to identify third-grade students in need of remedial reading education.5
The universal implementation of the third-grade reading test marked an end to the era of local control in Wisconsin testing. The era was characterized by the slow evolution of statewide testing policy. Wisconsin went from optional testing to testing a sample of pupils statewide to mandating districts to administer the test of their choice to narrowing the choices of tests from which districts could choose to finally requiring a single test for a specific demographic of pupils in public schools across the state.
State Control
The era of state control of testing policies can be traced to the February 1990 creation of an education commission convened with the goal of submitting a plan on the future of Wisconsin education to Gov. Tommy Thompson and DPI Superintendent Herbert Grover. Former University of Wisconsin regent Ody Fish was chosen to chair a group called the Commission on Schools for the 21st Century. The commission had 75 members, eight committees (including an Educational Assessment Committee), and held more than 170 meetings over the course of eight months.
From this early point, politics was a factor in shaping educational assessment policy. Here’s how Fish described the makeup of the commission to the Milwaukee Journal: “25 commission members were Thompson supporters, 20 were solid Democrats … and the remaining 30 were not known political partisans.”6
The Fish Commission delivered its sweeping report in December 1990; Fish called the proposals “bold,” and declared, “The public is more receptive to an educational evaluation now than they’ve ever been.”7
The report made dozens of recommendations, including a common statewide school report card and the creation of “A formal educational assessment policy for the state.” The commission’s report listed seven characteristics necessary for an effective Wisconsin state testing policy:
- Provide for comparability of results across districts over time;
- Require accountability for outcomes;
- Facilitate feedback from test results to improve instruction, the curriculum and staff development;
- Assess higher-order thinking skills;
- Be aligned with the state curriculum framework;
- Provide reliable results;
- Engage student interest.
Few of these goals were reached over the next 10 years.
The Fish Commission spun off a Blue-Ribbon Implementation Committee designed to “convert recommendations to actual statutes and rules.”8 The commission led to the passage of 1991 Act 269, legislation that simultaneously created mandatory attainment testing for Wisconsin pupils and introduced a ban on using test scores to evaluate public school teachers. This law forbidding the use of student test scores for teacher accountability is peculiar in light of the second and third goals listed above.
Committees were becoming a familiar feature of the state testing landscape. Act 269 created two committees: the Educational Goals Committee and the Pupil Assessment Committee. The goals committee had 12 members, including the governor, DPI superintendent, the president of the University of Wisconsin System, the director of the state Board of Vocational, Technical and Adult Education, and eight members jointly appointed by the governor and DPI superintendent.
The Pupil Assessment Committee consisted of teachers, parents and “other interested parties” appointed by the DPI superintendent.
The result of the committee process was a decision to fulfill the statutory requirement for statewide, standardized assessment by using an off-the-shelf test starting in 1992-’93 while simultaneously developing a new test for use in 1996-’97. That action was in conflict with the Fish Commission’s recommendation for testing continuity that allowed for longitudinal comparisons. In fact, Wisconsin would switch testing providers multiple times in the 1990s. While standardized testing was becoming the norm, the ability to measure progress over time continued to be a goal rather than a reality.
In 1992-’93, the state contracted with the ACT Corporation to give the Explore test in grade eight and the Plan test in grade 10. After only one year of giving the ACT tests, Wisconsin switched to the SAT-8 test developed by Harcourt Brace. The SAT-8 was also a national test that allowed for national comparisons. However, Wisconsin used it for only three years. In 1996-’97, the state switched tests again, this time to the TerraNova, a test developed by CTB/McGraw-Hill.
The switch to the TerraNova was controversial. A 1998 Legislative Audit Bureau (LAB) report found that DPI was unclear with CTB/McGraw-Hill about its expectations and deadlines. This lack of clarity created problems for school districts, most notably the Milwaukee Public Schools, where the release of test results for over 16,000 students was significantly delayed.
Districts also complained, according to the LAB, about the inability to compare results on the new test with those on the old, a problem that “impaired the department’s and school districts’ ability to identify trends in student achievement.”9 Non-comparability of results over time is a predictable result of switching achievement tests. The LAB addressed this problem by recommending that DPI stop bidding out testing contracts every three years. Though the testing contract continues to be bid out every three years, CTB/McGraw-Hill has remained Wisconsin’s standardized testing vendor since 1996-’97.
A single contractor for state tests did not, however, automatically create a system where standardized test results could be compared over time. There were two complicating factors: the creation of proficiency cutoffs, and the timing of state tests.
In 1997-’98, DPI began dividing student test scores into four categories still in use today.
- Minimal
- Basic
- Proficient
- Advanced
The obvious advantage of using these categories is that they are intuitive indicators of student achievement levels. However, the changing of cut scores—the dividing line between the categories—in 2002 and 2005 undermined the ability for longitudinal analysis of changes in the percentage of pupils in each category. A second problem was inconsistent timing of test administration. It was first given in the fall, then moved to the spring between 1999 and 2002, and then moved back to the fall. It is problematic to compare the test results of students in school for a few weeks with those who have received nearly a full year of instruction.
The 1990s saw an expansion of the state’s role in measuring student outcomes in Wisconsin. Not only were all districts required to give common assessments, they were required to give assessments designed to measure performance against specific state-created standards. However, state control of testing policy did not make testing policy effective. The era was marked by attempts to secure broad support throughout the education community, attempts that ended with testing policies based on vague goals.
More problematic, continuous attempts to improve assessment policies led to frequent changes in testing policies, which made the important goal of continuity elusive. The era of state control saw more information on student performance than ever before, but the usefulness of that information was limited. After a decade of mandatory testing, Wisconsin citizens still had no consistent measure of how their schools were impacting student achievement.
Federal Control
The passage of the 2001 NCLB act is a logical break point between the eras of state and federal control of Wisconsin assessment policies. NCLB set high goals for the nation, demanding that subgroups of pupils (including racial subgroups and low-income, limited-English, and special-needs pupils) be deemed proficient on standardized tests by 2014 and meet adequate yearly progress (AYP) goals along the way. Failure to meet goals meant increasingly onerous sanctions.
NCLB raised the scope and stakes of standardized testing in the state significantly. Until its passage, Wisconsin was requiring tests in key subject areas in grades four, eight and 10; NCLB mandated that tests be given in grades three through eight and 10. The law also required states to track school and district performance and to impose state sanctions on schools and districts that failed to meet AYP.
However, NCLB did not require that states use a specific test or even a specific type of test. Nor was NCLB focused on using tests to guide instruction. It was a way to understand the current level of achievement in a school or district, and perhaps to motivate schools and districts out of fear of sanction.
DPI made several changes to its testing policies in order to accommodate the implementation of NCLB. First, arguing that it was necessary to measure student achievement early in the year to make sure a child was not socially promoted (which was banned under NCLB), DPI in 2002 moved the WKCE to the autumn from the spring.10 The change made it impossible to compare WKCE results after 2002 with those before 2002 and drew complaints from schools and districts that argued that school performance should not be measured based on students who had been in a school for only a few months.
However the most damaging change in the federal era was the “realignment” of testing cutoff points for the purposes of determining student proficiency levels.11 In February 2003, DPI created new proficiency cutoff points through a standard-setting process based upon “extensive teacher input across content and grade levels.”12 The new cutoff points were made at the same time that the WKCE was customized for Wisconsin, meaning the results of the test could no longer be compared to students nationally. The testing customization as well as the new cutoff points once again made it impossible to compare current WKCE results with those of prior years.
Changing cutoff points simply meant that it was easier for a pupil to be labeled proficient than in the previous year. Say one year a score of 50 to 74 was considered basic, and a score of 75 to 100 was considered proficient. Now say the next year, the range for what is considered proficient is changed to 65 to 100. A pupil scoring 70 would be basic in year one and proficient in year two. There would be no change in student achievement, but state test scores would look better by virtue of having more students labeled proficient.
In 2005-’06 Wisconsin again changed the cutoff points used to determine proficiency. The new cutoff points made comparisons with earlier years suspect and were criticized as being too easy of a benchmark to meet.13
In spite of the lower proficiency standard, there has been a consistent uptick in the number of Wisconsin schools failing to meet Adequately Yearly Progress (89 in 2010). There has also been a corresponding uptick in state and national criticism of NCLB’s unrealistic goals. By 2011, DPI had announced its plans to phase out the state’s current assessment system and to seek a federal waiver to be exempted from the restrictions of NCLB in favor of yet another new assessment system. The new system is being developed in a consortium with dozens of other states.
The era of federal control, like previous eras, started with ambitious goals to ensure universal proficiency on standardized tests. And just like those previous eras, it was characterized by inconsistent assessment policies that failed to deliver usable accountability information to Wisconsin citizens.
Multi-State Cooperation
In 2010, Wisconsin joined 45 other states by signing onto the Common Core Standards Initiative. It was the first state to implement the standards. The mission of the initiative is simple and ambitious:14
“[P]rovide a consistent, clear understanding of what students are expected to learn, so teachers and parents know what they need to do to help them. The standards are designed to be robust and relevant to the real world, reflecting the knowledge and skills that our young people need for success in college and careers.”
Wisconsin has also joined 29 other states (covering about 23 million K-12 students) in forming an assessment consortium charged with creating assessments capable of measuring student progress toward the Common Core Standards and College and Career readiness. These new assessments, slated to begin in 2014-’15, would include both a required summative assessment (an annual broad achievement test similar to the WKCE) and optional benchmark assessments to help inform instruction and guide the use of interventions. (These different types of assessments are described in more detail in the next section.)
Multistate assessment consortia represent new ground for American education—a common set of standards and two assessment systems used across large swaths of the country.
Wisconsin is currently working with 26 other states to develop a new state standardized assessment called the Smarter Balanced Assessment. However, some specifics remain vague, and prior experience suggests caution in concluding that ambitious and well-intentioned efforts will result in lasting improvement to standardized testing. Ambitious goals, political consensus and dissatisfaction with current practice can guarantee change, but not necessarily for the better.
The remainder of this report will explain the shortcomings of the assessment system currently in use in Wisconsin, describe goals of a new assessment system, and recommend a framework for creating a long-term solution to Wisconsin assessment policy so that the latest testing era does not meet the same fate as those that preceded it.
Positives and Negatives of Current Wisconsin Testing Practices
What has become known as standardized testing is designed to serve at least three different purposes:15
- “To evaluate the quality and level of pupil achievement and indicate what pupils, teachers, schools, districts and states can do to improve their performance;
- “To provide accountability information (the relationship between public investment in education and pupil achievement); and
- “To provide information that can be used by teachers and pupils in decisions relating to remediation, program placement and career paths.”
Unfortunately, Wisconsin’s current standardized test, the WKCE, misses the mark on all three functions.
As previously mentioned, the current WKCE is a product of the NCLB Act. NCLB was designed to reward states for the percentage of students at proficiency and penalize them for students failing to reach proficiency. The law also allowed states to set their own standards for proficiency rather than setting one for the whole country. Thus, for states, the choice of proficiency level meant the difference between setting a high bar and having many schools showing disappointing scores, and setting a low bar and lulling schools into a false sense of security in terms of how well they are doing in comparison to students in states with higher cut points. Wisconsin chose the path of least resistance, setting a low bar so that it had fewer failing schools and fewer unhappy school and district leaders. The next section illustrates how we stack up compared with other states across the nation.
National Benchmarking
Comparing Wisconsin’s proficiency levels to the ones set by the National Assessment of Educational Progress (NAEP), also known as the Nation’s Report Card, is instructive. The NAEP, administered by the U.S. Department of Education, is the largest nationally representative sample and continuous assessment of what students know and are able to do in math, reading, science, writing, the arts, civics, economics, geography and U.S. history.
Though optional through much of its history, state participation in NAEP testing became a requirement to receive federal funding in 2002-’03. The NAEP is given to a sample of fourth-, eighth- and 10th-graders each year in various subjects (subjects are rotated from year to year). Since the U.S. does not give uniform assessments to students in each state, NAEP is the closest thing to a yardstick to help understand how Wisconsin students are performing compared with students across the country.
The NAEP is fundamentally different from the WKCE. It is designed to yield national data that allow for comparisons between states, but it is not designed to take the place of a state test. Because of its charge, it is taken by a representative sample of public and private school students in the state and cannot be used to compare the performance of individual schools or districts. According to the National Center for Education Statistics, on average a representative sample of 2,500 students in 100 schools take the NAEP in each state. In contrast, over 400,000 students in Wisconsin took the WKCE in November 2010.16
While different tests, the WKCE and the NAEP do use similar terminology when measuring student achievement. The NAEP has four categories of performance: advanced, proficient, basic and below basic. The WKCE’s categories are advanced, proficient and basic. Comparisons of the percentage of students in common categories in the NAEP and the WKCE reveal the different standards for each test.
Let’s use fourth-grade reading as an example. There has been much interest recently in Wisconsin’s reading scores, including a Governor’s Task Force focused on ensuring that all students can read at grade level by third grade. According to the WKCE, in 2009, 80 percent of students were reading at either the proficient or advanced level. While this might sound promising, a study conducted to see how 2009 state standards for proficiency compare when mapped onto a NAEP scale revealed a different story. Wisconsin, along with 37 other states (Wisconsin is 13th lowest), sets the proficiency level on its state test below the standard for “basic” on NAEP. (See Figure 1.)
Figure 1
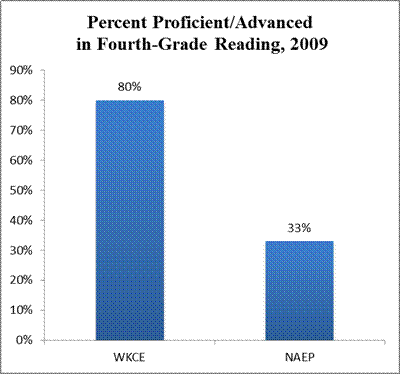
In fact, of the sample of Wisconsin students who took the NAEP in 2009, only 33 percent were proficient or advanced according to the NAEP benchmark, compared with 80 percent proficient on the WKCE. Similar trends hold true for reading in grade eight as well as for math in both grades.
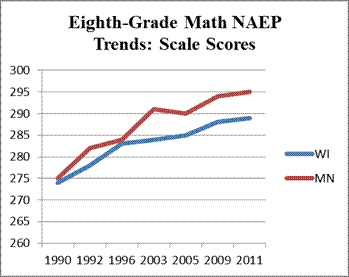
The end result? Wisconsin students, parents and the public have an inflated sense of how well they are doing. This is not an abstract fear. Figures 2 and 3 show that on the NAEP, Wisconsin pupils are losing ground to Minnesota pupils. 17
Figure 2

Figure 3
This also means that both student time and taxpayer money are being underutilized in Wisconsin. Our education spending and instructional decisions, such as where to target interventions for struggling students and ineffective teachers, are being based on information that is inadequate when compared with tools that are widely available and used in other states. One consequence of our inadequate information is that Wisconsinites continue to believe the state’s education system is thriving. Polling conducted by WPRI in 2010 found that 79 percent of Wisconsin residents think the quality of the state’s K-12 education system is similar to or better than other states.
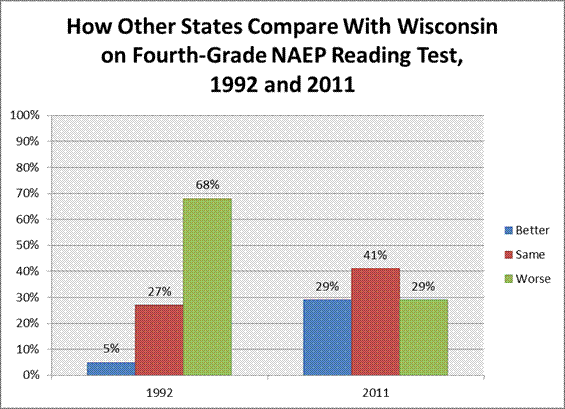
However, this belief is out of step with reality. Wisconsin’s racial achievement gaps in particular are among the highest in the nation. And the problem is not confined to sub-populations; Figures 4 and 5 show that Wisconsin’s performance on the NAEP relative to other states has declined over the past two decades.
Figure 4
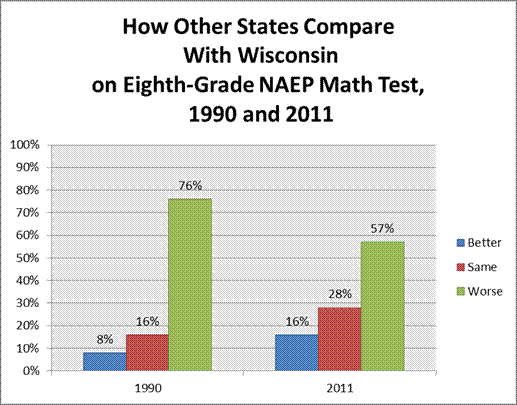
Figure 5
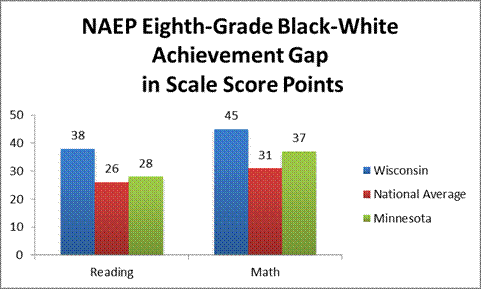
In addition, Wisconsin’s biggest problem lies in the glaring achievement gap between black and white students, as illustrated in Figures 6 and 7. Figure 6 illustrates the size of the gap for Wisconsin eighth-graders; Figure 7 illustrates how large this gap is compared with the national average and with our neighboring state of Minnesota.
Figure 6
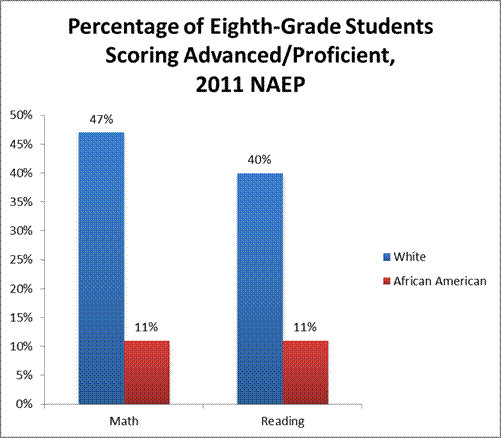
Figure 7
Benchmark Testing
Benchmark assessments are given at multiple points during a school year to assess student progress toward a designated target or proficiency level. Many, but not all, Wisconsin school districts administer benchmark assessments two or three times a year on their own initiative. The cost of this testing comes out of school district operating budgets. Wisconsin school districts use a variety of testing companies, but the majority use MAP (Measures of Academic Progress). The MAP test is developed by the nonprofit Northwest Evaluation Association and is used in public and private schools throughout the country. A total of 341 public school districts, independent charter schools and private schools in Wisconsin use MAP testing.
While the WKCE is an accountability test that gives broad indicators of student achievement levels, the MAP is a teaching tool that gives individual teachers actionable information that can be used for educational interventions at the school level. As one director of instructional services in a district utilizing MAP explained, “The WKCE is a lagging indicator at best. MAP gives teachers information about what kids know and don’t know in real time, allowing them to flexibly group kids and work with them on what they don’t know.”18
Besides being a much more timely indicator of student performance, MAP is an online, computer-adaptive test, meaning that as students move through the questions, the difficulty is adjusted based on whether they get the questions right. This helps get a more accurate read on what kids really know, since it ensures the test isn’t too easy for kids at a higher level or too hard for those at a lower level.
In addition, students in many different states take MAP, meaning results of the test can be used to compare the performance of Wisconsin pupils with students in other states. In other words, the MAP can both aid instruction directly as a classroom tool and indirectly as a way of providing context to Wisconsin achievement levels.
The current plan for implementation of Smarter Balanced in Wisconsin makes benchmarking voluntary, which likely means less than full participation by school districts. Without universal participation, a complete statewide picture of student progress throughout the school year is impossible.
The cost per student to administer the MAP test varies slightly based on the percentage of students in a school district taking the test, but the range is between $12.50 and $13.50 per student for reading, math and language arts and an additional $2.50 per student for science. Contracts are generally annual but can run two to three years depending on the preference of the district. This costs less than the WKCE, which is more like $39 per student. However, MAP cannot replace the summative assessment required for compliance with No Child Left Behind or its equivalent in the waiver process Wisconsin is about to undertake.
In general, Wisconsin needs to raise the bar in terms of setting high expectations and consistency for students, teachers and schools. The next section offers a tool that can, at the very least, help teachers and schools understand how much value they are adding to student learning, helping identify both areas in need of improvement and areas of strength.
Value-Added Analyses of Student Test Scores
Up to this point, this report has discussed the various shortcomings of the current state assessment system in Wisconsin as well as the plan for a new state system. Though these changes are needed, it is important to note that more could be done with the data from the tests currently being administered. At the top of this list is applying value-added analysis, a statistical method of separating out the effect that teachers and schools have on student academic growth by controlling for factors outside the teacher’s control, such as student poverty level and prior achievement.
Value-added analysis is a powerful way to improve the quality of information gleaned from the tests taken by Wisconsin schoolchildren. The need for such an approach is grounded in the limited value of snapshot test score data as well as the fact that students start each school year with widely varied achievement levels.
A value-added analysis is a method of understanding how much a student’s achievement has grown during a school year controlling for nonschool sources of student achievement growth like prior achievement and student and family characteristics. It is not a test that students take, but rather, it is a method of analyzing the results of student assessments (such as the WKCE or MAP) to help separate out the contribution of the school or the teacher (depending on the specification of the model) to the student’s progress. Unlike a raw test score, a value-added analysis can isolate the real impact of schools and teachers on academic achievement.
For example, a sixth-grade student scores a 231 on his fall MAP assessment in reading. The district reports that the average reading score for a sixth-grader is 221. To what extent can this student’s success be attributed to his fifth-grade teacher? Value-added analysis would look at his fifth-grade fall reading score, make a prediction based on that score and other background characteristics (poverty, special education status, etc.), and then measure his actual sixth-grade score against the prediction. If the student outperforms expectations, it is likely that he had a highly effective teacher. With this example, if the student had scored right around the average every year except this one, the fact that the score was significantly above average this year is likely to be related to the strength of his fifth-grade teacher. If this child scored approximately 14 points above the average every year, the value added attributable to the teacher would be lower.
Why is Value-Added Analysis Important?
To understand how much students are learning, teachers and administrators need to be able to measure how much growth students exhibit, not just what level they’ve attained. Otherwise, it can be easy to mistake a school that starts with a high-achieving population as a high-performing school even if students make less than a year’s worth of progress or, conversely, to label a school that starts with particularly low performers as low-performing even if students make more than a year’s worth of progress. When using student progress as the measure and controlling for background characteristics, it is possible to see how productive a school is rather than just the percentage of students that have achieved proficiency by a particular grade level. It’s also a more fair measure of growth for teachers and schools working with harder-to-educate populations. This should not be confused with having low expectations for some students, as some might argue. It is merely factoring in all the things we know impact a student’s performance on a test to better isolate the effect of the teacher and/or school.19
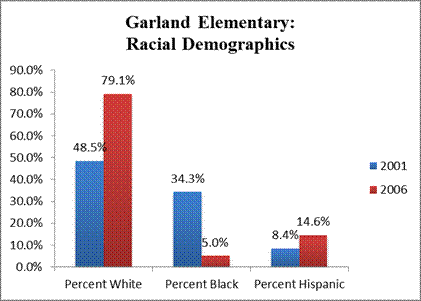
The current Wisconsin standardized tests measure students at a point in time in the fall of the school year. Say for example a school has 90 percent of students score proficient on the WKCE. Simply knowing that fact yields no information as to how the students came to score that highly. How many were high achievers in the previous year? How many are getting the bulk of their instruction at home? What impact is the school actually having? The problem with not knowing how to answer that question is illustrated by Garland Elementary School.
Garland Elementary, a Milwaukee Public School (MPS) on the south side of the city was featured in a 2007 Milwaukee Journal Sentinel article as an example of a successful school turnaround. William Andrekopoulos, then superintendent of MPS, said of the rise in test scores at Garland, “We’re hoping it’s Garland today, the rest of the district tomorrow.”20 The school did indeed have dramatic improvement in its WKCE scores between 2001 and 2006.
It is logical to assume the school simply improved. However, the test scores failed to account for a major shift in Garland’s demographic profile. The changing demographics beg the question, did Garland show improvement in its test scores because teachers were doing a better job educating students, or did new, high-achieving students flood into the school?
Figure 8

Figure 9
Value-added analysis can answer this question by:
- Establishing a baseline test score for individual students;
- Tracking student growth on a common test over time;
- Using statistics to isolate the portion of student growth that is attributable to the school.
It is important to note that while value-added analysis is widely acknowledged as providing educators with fairer and more accurate measures of student growth, detractors mention several potential shortcomings. These include the inability to calculate value-added scores for non-tested grades and subjects, the difficulty in assigning a particular teacher to a particular student in a team-teaching situation, and the potential noise in the statistical model because of the factors for which controls cannot be included.21 More recently, critics have objected to the use of value-added testing to publicly rank teachers by effectiveness in New York and Los Angeles.
In Wisconsin, MPS was an early adopter of value-added analysis to better understand the differing levels of productivity of each of its school buildings, and it provides some insight into what actually occurred at Garland Elementary. The district reported that in 2005-’06 Garland was a high value-added, high-attainment school in math, and a low value-added, high attainment school in reading. In other words the turn-around at Garland is nuanced. The school added to the growth in student achievement in math, but the reading gains are attributable primarily to the type of student enrolled at Garland.22
MPS began using value-added analysis a decade ago at the school level and does so in conjunction with the Value-Added Research Center in Madison. Although VARC has begun calculating value-added at the classroom level in Milwaukee, MPS does not use value-added to identify, reward or remove teachers based on effectiveness.
This is largely because until recently, both state law and local collective bargaining prohibited this sort of use. But this could change with the passage of Act 10, which eliminated most collective bargaining provisions, and Act 105, which allows the use of value-added analysis of student test scores, as part of a comprehensive evaluation, to discipline and dismiss a teacher.23
As districts move into the brave new world where seniority no longer rules, measures of effectiveness in the classroom will become even more important. It is worth noting, however, that when value-added analyses of student test scores are used to evaluate teachers, more than just one year of data is necessary to ensure that the assessment is fair. Anomalies that are hard to control for statistically can occur in any given year, making the average value-added score over three years a much fairer measure of a teacher’s effectiveness.
Generally speaking, the higher the stakes that are attached, the higher the level of confidence needed in value-added estimates. For example, if value-added analyses of student test scores are used to decide whether or not teachers are receiving bonuses, a great deal of confidence is needed in the estimates. It is important to have good data linking students to teachers and as many other statistical controls as possible. For example, the Madison school district collects information for all students on the highest level of education obtained by students’ mothers, which is a better predictor of student success than poverty status on its own. This helps increase confidence in the value-added estimates.
VARC currently calculates a value-added score for every school in the state with tested grades (third through eighth). This information, available to a district upon request, comes with a commitment to learn more about how to use this data to improve student learning. Forty-six school districts, including many of the larger districts in southeastern Wisconsin, currently receive and have been trained to make use of the data. Specifically, these districts are analyzing the amount of growth occurring in their schools so that they can home in on the instructional improvement that needs to take place in some schools and so they can learn from the best practices occurring at the high value-added schools.
The next logical step is taking value-added analysis to the classroom level. Giving teachers access to information that enables specific education interventions can improve their performance and, correspondingly, the educational outcomes of their pupils.24
Sometime in spring 2012, DPI has promised to make these value-added estimates available to all districts through SAFE, or Secure Access File Exchange. While having access to this data is important, the training (which is detailed later) is essential to using the analysis for instructional improvement purposes.
Other States
Beyond Wisconsin, VARC has contracts with Florida, Illinois and many large school districts, including New York, Los Angeles, and Chicago, helping them understand how effective their schools and teachers are by calculating value-added scores from the student test data that each site provides to VARC. Founded in 2004, VARC is housed within the Wisconsin Center for Education Research and funded by grants from a variety of sources including the U.S. Department of Education and the Walton Family Foundation.
No states currently are using value-added analysis on a statewide basis. However, VARC has been in conversation with a number of states about such a system. Some of these states, also located in the Midwest, are interested in potentially having a regional value-added system that would make the data comparable across states. This could give Wisconsin citizens a better indication of how Wisconsin school performance compares to other states.
A few other states do use statewide growth measures, which, like value-added analysis, are based on tracking changes in student performance. Arizona, Colorado, Indiana, Massachusetts, North Carolina, Ohio, Pennsylvania and Tennessee all have testing systems based on student growth.
In all of these states, there have been difficulties getting data to all audiences able to use it. For example, in Tennessee, until this year the data was only available to schools and teachers—the state was not allowed to see the teacher-level reports. The same is still true in Ohio, while Pennsylvania and North Carolina do not report classroom level value-added at all.
At What Level are Analyses Currently Being Calculated by VARC in Wisconsin?
VARC is currently conducting statewide value-added calculations at the grade level that make it possible to tell what the school but not the individual teacher contributes to the student’s progress. In other words, value-added data gives schools and districts access to data that isolate the impact a school is having on student achievement. It is more difficult to calculate value-added analyses at the teacher or classroom level because it requires that teachers be electronically linked to their students. Some districts have managed to create these linkages, but they do not yet exist statewide. DPI is working on a teacher-student linkage and hopes to have one in place for the 2012-’13 school year.
As mentioned, value-added analysis can be performed using a variety of different tests, from the once-a-year state test (WKCE) to more frequent benchmark assessments (such as MAP). Ultimately, using value-added analyses of the results of the state’s upcoming Smarter Balanced Assessment system, schools should have student growth data to inform education decisions (such as which teachers need professional development to become better reading teachers) at multiple points throughout the school year.
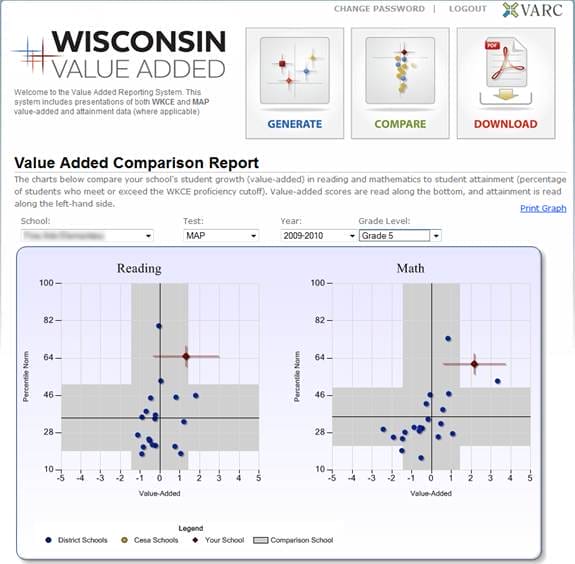
Figure 10 gives an idea of the type of information school leaders in particular can receive from value-added analysis. The chart specifically compares a Wisconsin school with peer schools in the same district. Schools are indicated with dots on the graph. The horizontal axis tracks the value being added by the examined school. In summary, a positive value-added score means students are performing higher than expected given their demographic profiles, and a negative value-added score means students are performing lower than expected. The vertical axis is an absolute measure of student performance at the time the test was administered expressed in percentile norms, which gives their ranking in comparison to how other students taking the test performed.
As you can see in Figure 10, schools are graphed in quadrants. Those schools in the upper left-hand quadrant are high-achieving but low value-added, which means that students at this school achieve at high levels but have below-average value-added growth. It is likely that students at this school are high-income. This is important information for the district to have, because all parents want their children to reach their full potential and if they are not even growing as much as the average school, these schools could be doing more for the students—for example, implementing a more rigorous curriculum.
Schools in the upper right-hand quadrant are high-achieving, high value-added. This is the school we all want for our children or grandchildren. Not only are they achieving at high levels, but they have above-average value-added growth, meaning that controlling for background, these students have made more progress than the districts in the upper left hand quadrant with low value-added growth as described in the previous paragraph.
Schools in the lower right-hand quadrant are low-achieving but high value-added, meaning that not as many students are at the level of proficient or advanced (which is where we want all students to be) as they should be but, controlling for background, students at this school are growing at an above-average rate. It is likely that this is a high-performing, high-poverty school where students came in with less knowledge and skill than more affluent students do, but the teachers in this school are helping them reach their potential by ensuring that they exhibit growth over the course of the school year.
Finally, schools in the lower left-hand quadrant are really in the danger zone. These schools are neither high-achieving nor high value-added, meaning their test scores started low and didn’t grow as much as they should have over the course of a school year. Districts would want to target the most extreme interventions in these schools to ensure that students don’t continue to attend schools where they don’t have the teachers they need to reach their potential.
Figure 10
What is the Mechanism by Which Districts Receive Value-Added Information?
VARC creates reports that can be printed or downloaded and then distributed to teachers and principals in the district. When the data are ready to be released, VARC holds professional development sessions in conjunction with district leadership where school leaders are presented with hard copies and given training about what to do with the data.
Specifically, training begins with a basic overview of what value-added analysis is and how the information produced differs from traditional reporting of testing results. In addition, attendees are given an overview on value-added initiatives elsewhere. Once a base level of knowledge is reached, attendees are taught specifically how to use analyses to make school and district policy decisions. In other words, attendees are taught what logical policy responses, such as moving a teacher, changing an instructional approach, etc., specific value-added results suggest. VARC also trains individuals to become value-added coaches so that they can become school- and district-level resources.
Steps to Using Value-Added Data Statewide
As discussed here, this powerful data analyzing student growth is widely available but underused. To correct this, it is necessary for the state to take specific steps to ensure that districts, schools and teachers all receive and know how to use value-added data.
1. Adding Value-Added to the Statewide Student Information System
The Wisconsin Department of Public Instruction (DPI) currently posts data on student achievement, spending and demographic information online for every school district and school in the state. DPI has indicated plans to upgrade this system and add value-added data for the 2012-’13 school year, but it is not clear yet whether it will meet this target.
One option to help ensure that this happens is to modify state law to require that value-added data be included in annual school and school district reports. This may or may not be necessary, depending on the actions of the DPI. Many decisions made by education task forces, including the educator-effectiveness design team, involve the use of value-added data, so all indications are that this information will be made available statewide as soon as possible.
2. Ensuring Teachers and Principals Receive Value-Added Data
Another logical statutory change is a requirement that all Wisconsin public school teachers and principals be given the results of their district, school and classroom value-added analyses every year. Teachers and principals are best positioned to use VARC data to raise student achievement; ensuring that they receive the information is a necessary first step to putting it to good use. The fact that DPI plans to make the data available through its Secure Access File System (SAFE) will mean that districts will get the results of the school-level analyses currently being conducted statewide.
3. Ensuring Districts, Principals and Teachers Know How to Use Value-Added Data
As mentioned, 46 districts are currently using VARC data. Those districts (which include Milwaukee, Madison, Racine, Greendale, Verona and Waunakee) have received formal training on value-added analysis from VARC. These districts have paid for this training using their professional development budgets, some of which come from federal Title II funding.
Providing this initial training to all school districts is an important step to implementing a statewide system. In addition to districts receiving training directly from VARC, it is possible to train Cooperative Educational Services Agency (CESA) administrators, who oversee school districts, to give districts basic training in using value-added analysis.
It is also essential that the next generation of teachers be trained in the power of data. Wisconsin schools of education should include training on ways to use current data-analysis techniques, like value-added, in their curricula.
4. Including All Publicly Funded Pupils
The power of value-added data should not be limited to traditional public schools. Charter schools as well as private schools participating in the Milwaukee Parental Choice Program (all of which administer the WKCE) should be included in a statewide implementation of value-added testing. Given the documented high rates of mobility in Milwaukee, not including all schools with publicly funded pupils would be a missed opportunity.
Likely Obstacles to Implementation
The most likely obstacle to implementation is cost. There are three components to the cost. First is the cost related to making the information available to teachers and principals, estimated at dollars per school or per student. The second cost element is related to the formal, two-day training from VARC. This would cost an estimated $1,500 per district. However, this does not include the cost of teacher/administrator time or substitutes or travel or any other cost associated with professional development. As mentioned, districts that have voluntarily used the VARC data have generally used federal funds to pay for the training.
However, a statewide implementation would likely require more than federal funds. An inquiry with VARC shows that the estimated cost of producing additional analyses, such as value-added analyses of benchmark assessment data, reporting additional analyses, and providing additional professional development would cost between $250,000 and $300,000 annually. While significant, this cost is only 2.5 percent of the $12.5 million in federal and state funds currently spent annually on Wisconsin’s pupil assessment program.25
Another possible obstacle is political concern over a legitimate question: Why VARC? First, VARC is already producing value-added analyses for Wisconsin districts, including high-need districts like Milwaukee and Madison. Second and more importantly, VARC’s methodology is highly respected nationally, as evidenced by its work in districts across the nation, including Atlanta, New York, Tampa Bay and Tulsa. Nonetheless, if the legislature chooses to adopt a statewide value-added system, a bidding process that allows other producers of value-added analyses to submit proposals should be considered.
Another likely political concern is what will be done with value-added information, specifically, will the controversial publication of teacher level value-added rankings mentioned earlier be replicated in Wisconsin? As of now, no. Wisconsin Act 166, signed into law in April 2012, prohibits the publication of teacher evaluation ratings.
The political and monetary barriers to implementing statewide use of value-added data are minimal in comparison to the upside of giving administrators and teachers actionable data to aid student achievement. Knowing which schools, and in some cases, which teachers, are getting the best results can help target improvement efforts and help identify high-fliers. In the short-term, private foundation interest in paying for the comparatively minimal costs of implementation should be pursued, and the potential to leverage federal and state funds currently earmarked for assessment and professional development should be explored.
If and when the Wisconsin budget outlook improves, additional investments in training should be pursued so that the potential of value-added analysis is fully realized. Such potential use includes the evaluation of specific curricula, teaching techniques, schools, principals and teachers. The expenditure would more than pay for itself by helping target professional development and other resources where they are needed most.
Conclusion
Past attempts to improve student assessment in Wisconsin provide reasons to view current efforts with caution. The promise of additional funds, the political cover of broad committees, and the satisfaction of setting less-than ambitious goals have too often led to student assessment policies that provide little meaningful information to parents, teachers, schools and taxpayers. A state assessment system should provide meaningful information to all of these groups.
Data on student progress can make the work of teachers, students, parents, administrators and policymakers more effective. It can ensure that during the course of the school year, students make progress toward their own growth targets and those who do not are flagged and interventions are done to get those students back on track. It should not come as a surprise that to have meaningful, timely data, one must administer meaningful, timely tests, and Wisconsin is falling short in this department in a number of ways.
School-level value-added analyses of student test scores are already being calculated for all schools with third- to eighth-graders statewide by a respected institution right here in Wisconsin. This information should be used by schools and districts to raise school and teacher productivity. We should continue to explore the use of value-added at the classroom level, a necessary step to implementing the new teacher-evaluation system proposed by the DPI that is statutorily required for implementation in 2014-’15.
In this era of scarce resources, understanding teacher and school productivity becomes even more important. To understand productivity, we need data that can indicate not just the level students have achieved but how much progress they made to get where they are. The need for this kind of information is beginning to take hold. More recent federal policies, such as the competitive Race to the Top Grant, require the use of growth scores. In addition, the federal government is accepting waiver requests from states to replace NCLB with a system that includes not just attainment but also growth. Although other methods of analyzing growth are available, value-added has the distinction of being the method that best controls for prior achievement and socioeconomic measures that have been shown to affect learning. This makes it fairer to teachers; even Wisconsin’s state teachers’ union has come out publicly in favor of value-added as one component of a new teacher evaluation system.
How well is Wisconsin positioned for this inevitable change to using growth to measure student progress? The state did not secure a Race to the Top grant in Round 1 or 2, but there are a number of signs that the pieces are falling into place now. Rapidly implementing a statewide value-added system would vault Wisconsin to the front of the pack in terms of states that put useful, uniform (and thus comparable) data into the hands of educators and administrators across an entire state. It would require considerable resources, but it would also help the state compete for federal money and give teachers and administrators meaningful data about student learning that they could use to improve their practice. That is a worthwhile investment.
Footnotes
1 Staff (2012, February 12) “New York Schools Release Value-Added Teacher Rankings.” Los Angeles Times.
2 Wisconsin Historical Society:
3 Wisconsin State Statutes (1975) 115.28(10).
4 1981 Local Option Testing Manual—Wisconsin Pupil Assessment Program—DPI, Barbara Thompson, superintendent
5 Wisconsin State Statutes (1988) 121.02(1)(r).
6Lamke, K. (Feb. 17, 1990). “Fish says education panel will be productive,” The Milwaukee Journal.
7Rinard, A. “Panel on future of schools sends idea list to governor,” Milwaukee Sentinel, Dec. 22, 1990.
8 Fish, Ody (Dec. 21, 1990) cover letter to the citizens of Wisconsin from the Commission on Schools for the 21st Century.
9 Wisconsin Legislative Audit Bureau (1998). Contracting for Statewide Student Achievement Tests, p. 25: http://legis.wisconsin.gov/lab/reports/98-4tear.htm
10 Merrifield, L. (2011). Pupil Assessment. Madison: Wisconsin Legislative Fiscal Bureau.
11 Wisconsin Department of Public Instruction (2012) History of the WKCE, 1975 through Present: http://dpi.wi.gov/oea/hist/histdev.html
12Wisconsin Department of Public Instruction (2006). Questions and Answers Regarding the New 2005-’06 WKCE-CRT Tests, Scales and Cut Scores: http://dpi.wi.gov/oea/pdf/q&a-sscrswlk.pdf
13 Carey, K. (2007). The Pangloss Index: How States Game the No Child Left Behind Act The Evidence Suggests Otherwise. Washington D.C.: Education Sector.
14 http://www.corestandards.org/
15Merrifield, L. (2011). Pupil Assessment. Madison: Wisconsin Legislative Fiscal Bureau. p. 1.
16 Wisconsin Information Network for Successful Schools, The Wisconsin Department of Public Instruction: http://dpi.wi.gov/sig/index.html
17 Note that Minnesota students participate in an international assessments such as the TIMSS (Trends in International Mathematics and Science Study), in which a minimum of 50 schools or 1,700 students from fourth and eighth grades must participate; PIRLS (Progress in International Reading Literacy Study), in which a minimum of 50 schools or 1,700 students from fourth grade must participate; and PISA (Program for International Student Assessment), in which the same size sample of a state’s 15-year-olds are tested in different subjects every three years. Wisconsin does not currently participate in any of these assessments. The recent positive achievement trends in Minnesota are illustrative of what can happen when a state sets high expectations.
18 Interview with Wisconsin school district superintendent, September 2011.
19 For more on how this has been validated: http://cecr.ed.gov/pdfs/CECR_HP_ValueAdded.pdf.
20 Borsuk, A.J. (Jan. 3, 2007). “MPS school shows how it’s done: Scores soar at Garland, where focus is on what kids learn.” The Milwaukee Journal Sentinel: http://www.jsonline.com/news/milwaukee/29254429.html
21 Roundtable Discussion on Value-Added Analysis of Student Achievement: A Summary of Findings (2007), The Working Group on Teacher Quality: http://www.tapsystem.org/pubs/value_added_roundtable_08.pdf
22 Milwaukee Public Schools 2009-’10 School Report Card, Garland Elementary: http://www2.milwaukee.k12.wi.us/acctrep/0910/2010_E_0191.pdf.
23 However, Milwaukee renewed its contract, in 2011, and thus remains unable to implement such reforms until 2013.
24 Chetty, R., Friedman, J. N., & Rockoff, J. E. (2011). The Long-Term Impacts of Teachers: Teacher Value-Added and Student Outcomes in Adulthood. [Working Article]. National Bureau of Economic Research.
25 January, 2011 LFB Information Paper, Layla Merrifield, 31 “Pupil Assessment.”