Vol. 24, No. 6
Executive Summary
Nothing is more important to the City of Milwaukee, its economy, quality of life and future, than safe streets and good schools. Impressive strides have been made toward one of those goals. Violent crime plummeted 23% between 2007 and 2010, and continues to decrease in 20111. Property crime is down significantly as well.
Unfortunately, there is no evidence of similar progress in Milwaukee’s classrooms. Despite large increases in per-pupil expenditures, test scores among tenth graders in the Milwaukee Public Schools have remained stagnant for years. Only 40% of MPS tenth graders are currently proficient in reading. It is little surprise that, according to a Refocus Wisconsin poll conducted by the Wisconsin Policy Research Institute, only 19% of Milwaukeeans say the district is doing an excellent or even good job.
Why has one highly unionized, large, public-sector organization, the Milwaukee Police Department, been so successful while another, the Milwaukee Public Schools, has failed by almost any measure? One key answer: data.
The Milwaukee Police Department uses data to make major strategic decisions on a daily basis. It puts numbers at the center of both its operations and culture, and uses them to focus on its core mission of fighting crime. From the top brass down to the cops in the squads, data drives both performance and accountability.
MPS has reams of data as well, a virtual warehouse of it. However, key data is often outdated. Value-added analysis is used too infrequently, and the school district does not use data to measure the performance of teachers and administrators, reward them or hold them accountable. While data is used to measure student proficiency, it is too rarely used to improve it.
The Milwaukee Police Department experience proves that placing data at the center of both the operations and the culture of a large, public-sector organization is both possible and essential to improving achievement. In the Milwaukee Public Schools, doing the same would also help reinforce the fact that good teachers can make a quantifiable difference.
Introduction: Faith and Alphabet Soup
The superintendent of the Milwaukee Public Schools, Gregory Thornton, says he has a motto he lives by: “In God I trust. Everybody else, bring me the data.”
Like most school superintendents across the United States, he has much to choose from. MPS collects data on everything from graduation rates to the prevalence of truancy to suspensions to expulsions. The district keeps track of how often students transfer from one school to another, of each student’s grade point average, attendance, gender, ethnicity, primary language, economic circumstances, and disabilities; and that’s just for starters. It administers or tracks an alphabet soup of student test results, including the WKCE, the ACT, and, most recently, MAP. In fact, it compiles what it calls a virtual “data warehouse” that supplies reports to Thornton and many others in the district every day.
The data in which Thornton professes to place his faith is plentiful, and MPS administrators—partly due to mandates like No Child Left Behind—have long used it to determine how students are measuring up.
They do not, however, use it in any ingrained, systemic way to measure the performance of two other key groups in the district: teachers and themselves. And despite a reputation for innovative use of data that some—including the Wisconsin Department of Public Instruction—consider a model worth emulating, MPS is not using it nearly as pervasively or frequently as either some other school districts or other large, public-sector, highly unionized organizations such as the Milwaukee Police Department.
The Milwaukee Police Department, like many other departments and even some city governments, uses data to make major strategic decisions on a daily basis, puts numbers at the center of both its operations and culture, and uses them to focus on its core mission of fighting crime. After a surge in crime in 2005 and 2006, crime in the city has dropped 23% since 2007, a decrease the department attributes largely to the focus on data.
MPS, meanwhile, is no longer on the cutting edge of determining how and when schools and educators are, in current educational parlance, adding value. Plans to expand the use of value-added analysis—a methodology that, ironically, is closely associated throughout the country with the district—to measure teacher performance are half-steps at best. And, while data is reviewed frequently by many administrators and staff in the district, talk of using it to make schools, teachers, and administrators accountable for whether students are learning is largely taboo.
Where data is concerned in MPS, there is more doubt than faith.
What follows is a look at why that is the case, how it is preventing the district from focusing on its core mission of educating kids in a time of decreasing enrollment and revenue, and why that must change if Milwaukee is to avoid losing another generation to poverty and hopelessness.
The Crime-Fighting Revolution
Milwaukee’s teachers and police officers do very different things. But a comparison of how MPS and MPD use—or don’t use—data provides insight into a primary reason Milwaukee’s schools are widely considered to be failing while Milwaukee’s squads, and the officers who drive them, have been successful by almost all measurable standards.
Milwaukee’s police department faces challenges similar to many others. By the mid-1990s, many police departments across the United States had embraced community-based policing and become more responsive to neighborhood-level issues. However, they lacked any sort of easily understood accountability system until what Milwaukee Police Chief Ed Flynn calls “the CompStat revolution.”
CompStat has been described by criminal justice professors George Kelling—a Milwaukee native and senior fellow at the Manhattan Institute—and William Sousa as “perhaps the single most important organizational/administrative innovation in policing during the latter half of the 20th century.”2 There is some debate over what the term actually stands for, whether it is “computer statistics” or “compare stats.” Likewise, there are differences in how it is implemented in various police departments. The commonalities: It is driven by data, and its goal is to reduce crime—an objective that may seem obvious but has historically been only one of many functions of American police departments.
As Flynn puts it, “The police are the social agency of first resort” for the poor, the scared, and the unnerved. “Even in a busy district, 80 percent of the time, you’re dealing with stuff other than conventional crime,” he said. “The criminal justice system and the police are the default position for mental illness or substance abuse, or family dysfunction, for everything.” Still, he said, “conventional crime still remains the core mission.”
“That doesn’t mean we can’t do that other work,” said Flynn, “but it means we have to really devise ways to rigorously focus on the core business of safe environments in which other stuff can occur.
“That’s where the CompStat revolution really had a dramatic impact on the policing profession. As we developed the capacity to more rapidly analyze information and turn it into intelligence, we began to develop accountability systems that could match up with the performance pressures police departments had.”
The focus on data creates the structure, in other words, to remain centered on that mission despite the fact that police have a plethora of constant distractions.
The drop in crime in Milwaukee in recent years cannot be solely attributed to Flynn’s focus on data. Many categories of crime increased dramatically throughout 2005 and 2006 before leveling off and starting to trend downward in late 2007 and early 2008. Flynn began his tenure in January of 2008, began daily crime analysis briefings in June or July of 2008, and began CompStat meetings at the end of the same year—and crime has generally trended downward ever since.
Milwaukee Annual Crime Statistics*
| 2007 | 2008 | 2009 | 2010 | % change | ||
| Violent Crimes | 8,063 | 7,396 | 6,671 | 6,200 | -23.1% | |
| Property Crimes | 38,731 | 37,034 | 35,300 | 31,581 | -18.5% | |
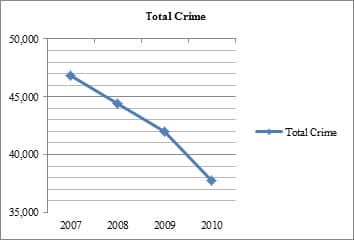
| Total Crimes | 46,794 | 44,430 | 41,971 | 37,781 | -19.3% |
* Source: Milwaukee Police Department
Milwaukee Crime Trend
The Place the Revolutionaries Forgot
Since 2002, the Milwaukee Journal Sentinel has written no fewer than 116 stories that mention both MPS and “school reform.” Over the same period, tenth-grade reading scores have remained stagnant while spending per student has risen.
MPS Tenth-Grade Reading Scores and Per Pupil District Costs
Year | Proficient or Advanced in Reading* | Spending per student** |
| 2010-’11 | 39% | Not available until 5/’12 |
| 2009-’10 | 40% | $14,674 |
| 2008-’09 | 40% | $14,183 |
| 2007-’08 | 38% | $13,319 |
| 2006-’07 | 39% | $12,471 |
| 2005-’06 | 40% | $11,885 |
Source: DPI
*Results for tenth-grade students enrolled for a full year who took the Wisconsin Knowledge and Concepts Exam
** DPI Comparative Cost per Member: http://dpi.wi.gov/sfs/cmpcst.html
(Costs are not adjusted for inflation.)
The Amorphousness of MPS
If police are not the latter-day social agencies of first resort, then schools are.
Societal issues and problems that don’t end up in the police department often end up in the classroom. Just as there has been debate over where and how to focus police resources, there has often been conflict over the role of schools that are also expected to feed, counsel, discipline, and, in essence, raise many of Milwaukee’s children—and also provide jobs for their parents.
There has been a fundamental, philosophical disagreement within MPS itself, in fact, over whether teachers and schools should be formally accountable for non-academic issues that many consider the logical purview of social services or even job agencies. The conflict, often an implicit backdrop to debate, arises in arguments over privatization that might cost public-sector, school district jobs in, say, the cafeteria, but also save money that could then be spent instead on books. It has manifested itself in some US school districts in the debate over, for instance, whether to use classroom time to serve breakfast. It manifested itself in MPS in the spring of 2002 during a little-noted school board discussion of a new “District Accountability System” that resulted in the reporting of district-wide and individual school test results to the public once a year.
One member who is still on the board today, Peter Blewett, proposed a formal accountability system for identifying schools that need improvement not just in academics—as is required by federal law—but in achieving goals “such as nurturing social and emotional growth” and “conflict resolution.”3
Blewett’s attempt to make the district formally accountable for amorphous, non-academic functions that cannot be measured, indeed for social and emotional well-being that has traditionally been the purview of either other government agencies or the private sector or families, narrowly failed. But he did garner the support of three other board members and his philosophy reflected a mindset in the district that has, at times, blurred or impeded a needed focus on testing and academics and data. In turn, the district’s inability to use data in a more public, frequent, and consistent way has allowed it—unlike in the Milwaukee Police Department—to too often lose sight of its core goal: making children smarter and better prepared for an otherwise daunting future.
History of-and Opposition to-Testing and Accountability in MPS
Back in the Old Days
Like all school districts in America, MPS has a long history of trying to assess student achievement. As recently as the late 1990s, this was often done through so-called “performance assessments” that were more easily defined by what they weren’t than by what they were. Supporters of performance assessments described them as something “other than multiple-choice or short-answer tests that are used to determine a student’s progress toward an academic goal.” They “include writing an essay, conducting a science experiment, giving an oral presentation, explaining in words how the students arrived at the answer to a math question, and so forth” according to the editors of Rethinking Schools Ltd.4
In the late 1990s, performance assessments were given annually to as many as 45,000 MPS children. District administrators, however, saw a fundamental problem: performance assessments were not standardized. Both the assessments themselves and the scoring varied widely, making it difficult to draw comparisons or track student progress from year to year.
MPS at that time already had to administer some traditional, standardized assessments that included the Wisconsin Knowledge and Concepts Exam (WKCE) in some grades. But because there were no standardized tests in other grades, progress could not be gauged over time in any consistently meaningful way that would help evaluate curriculum, teachers, and programs. The MPS administration in 2000, as a result, proposed a “Balanced Assessment System” with standardized tests for students in most of the grades not already covered. Administrators wanted a better, more consistent year-to-year tool—standardized tests—for measuring student proficiency in a traditional way. There was, in addition, also a desire to start using something new: “value-added” analysis of those same tests.
The Value of Value-Added
Deb Lindsey, the director of research and evaluation for MPS, stresses the importance of differentiating between traditional measurements of student proficiency and value-added analysis that has become de rigueur in some education circles.
Proficiency is a measure of the percentage of kids performing at a commonly accepted definition of grade level, and the commonly accepted benchmark of achievement. It is fundamentally unfair, some argue however, to use No Child Left Behind-mandated proficiency results to judge the effectiveness of Milwaukee schools by the same standards that are used to judge, for instance, schools in the affluent Milwaukee suburb of Whitefish Bay. Or, to compare different schools within MPS such as Rufus King and South Division. Rufus King, Lindsey points out, accepts only kids who have demonstrated high academic achievement. South Division, a neighborhood school, takes “literally every child who walks in the front door regardless of whether or not they even had a year, or a day, of formal education in English anywhere.” Comparing the two, without taking into account prior academic achievement—among other things—would be unfair to South Division teachers and administrators who may be helping children grow academically despite a very low starting point and a slew of negative outside influences. Value-added analysis makes apples-to-apples comparisons possible because it is able to measure the growth or the productivity that can be attributed to the school and view it separately from growth or lack thereof that is due to other factors.
Such analysis, if understood correctly, should logically have great appeal to good teachers in MPS who are making a difference and are, nevertheless, widely derided for teaching children who have low levels of proficiency and never seem to do as well as their suburban and small town counterparts. Nevertheless, at meetings throughout that spring and fall of 2000, opponents of annual, standardized tests and value-added analysis in MPS were vociferous, citing concerns about everything from testing methodology and reliability to financial issues to whether young students could handle the pressures of being tested consistently. While some board members supportive of new tests were heckled, another board member, Charlene Hardin, went so far as to say that if the board adopted the new assessment system it would be “destroying our children’s lives.”5
At one board meeting, 50 audience members held up signs and posters reading “No new tests” and “Educators did not earn college degrees to teach the ‘bubble system,’” a reference to multiple-choice standardized tests.6
Misplaced Fears of Whac-A-Mole
The fear that data-driven systems rob front-line employees of discretion and turn them into robots is not unique to the Milwaukee Public Schools. Police departments that have implemented CompStat and other data-driven systems have faced similar fears, according to a 2003 Police Foundation study noting that “a formidable challenge that CompStat presents to police leaders is how to increase accountability without inhibiting an environment that tolerates reasonable trial and error.” The same study, which focused on departments other than Milwaukee, criticized CompStat as engendering “a pattern of organizational response to crime spikes in hot spots that was analogous to the Whac-a-Mole game found at fairs and carnivals” rather than helping police “ascertain the bigger picture and act proactively to get at underlying problems.”
Data is indeed used to identify “hot spots” in Milwaukee. But it also is used to ascertain patterns and—through the department’s Predictive Intelligence Center—to attempt to foresee where crime will occur next. Flynn, in the meantime, insists that structure does not quash individual discretion.
“This department had a lot of people that were looking over their shoulder when I got here,” he said. But, he added, there “were still those cops who wanted to decide and do stuff.” The challenge, he said, was to “create an environment in which they feel the freedom to do that within structure.”
There is an obligation among the leadership, he added, to structure the organization around the “reality of (the officers’) work, not the pretense that they just follow orders and are held to rigorous rules and regulations. Because that’s not their life.”
The “point of it is we’re recognizing that functionally a police officer is an officer, not a private,” said Flynn. “Just because they have sergeants doesn’t make them privates. The point is, a police officer is our second lieutenant,” he added, using military analogy for officers on the front lines. “They’re the ones out there functioning unsupervised, under stress, making those decisions.”
How Data Drives Police Performance and Accountability
A Data-Driven Ritual
Each and every weekday morning, the top brass in the Milwaukee Police Department, including bureau commanders who appear via satellite on a screen in a meeting room in the Police Administration Building, hold crime analysis meetings at 9 a.m. On the morning of Jan. 20, 2011, for example, the data showed among many other things that there had been 11 car thefts in the First District in the prior week and 26 in that month-to-date—twice as many as in the same time period in 2010. The district captain noted that Honda Accords were being targeted and that a specific group might be using tow trucks to steal the cars—a telling detail because tow trucks are sometimes used by thieves who want to strip cars of their catalytic converters, the pollution-control devices that contain platinum and are worth as much as $200 as scrap metal.
In addition to providing a detailed synopsis of crime data that is just hours old each day, each district commander also reports on, for example, numbers of traffic stops, differential police responses (telephone reports), and “park and walks.” There is measurement of effort in addition to measurement of results.
Data is discussed briefly at the daily crime analysis meeting on the seventh floor of the Police Administration Building in downtown Milwaukee. But that is often simply a prelude to the CompStat meetings that take place at 10 a.m. down the hall several days a week. Data—often crime data but also information about things like officer overtime or arrests or sick days—is at the heart of the CompStat meetings as well. Those meetings also include the top department brass but focus on only a few of the department’s districts.
On the same morning of Jan. 20, the issue of motor vehicle thefts in the First District came up again and in more detail. More data was flashed up on an enormous screen that took up much of a sizable wall. Dozens of the top personnel in the department could see how the 26 vehicle thefts in the first 19 days of January far surpassed the 20 in that district in all of December and 21 in all of November.
“This has become a new crime of opportunity for some reason,” said Flynn while a crime analyst sitting in the back of the room took a note.
“So,” said Nicole DeMotto, the analyst, “I will look into the reason.”
Flynn later explained the necessity of breaking down such data even further and using it to devise strategy.
“Certainly at the first cut, the data is telling them there are stolen cars,” he said. But there are other questions: Are they cars stolen essentially for fun from people warming them up in their driveways? Cars criminals are stealing to use in another crime? Cars that will be stripped for parts, like catalytic converters? “The response to that may be we’re going to set up on the scrap yard and talk to the scrapper about catalytic converters and wait to get a phone call,” said Flynn. “Or we’ll look for tow truck guys. Or we’re going to stake out … the chop shop. So you have to disaggregate what looks like one problem.” And determine how best to respond.
While the collective focus on data sets up a structure for discussion and collaboration, there has been debate in police circles over how often CompStat truly encourages unique problem-solving. Looking for tow trucks and staking out chop shops are not new police techniques, after all. While the perceived extent of collaboration and joint-brainstorming may vary from police department to department (and, indeed, from one observer to another) there can be little doubt, at the same time, that CompStat brings facts about crime—as well as the mid-level managers responsible for fighting it—front and center on a daily basis.
Capt. Jack Frost and Limits on Determining Value-Added in MPD
There are limits on what data can measure in a police department. Much more so than schools, police operate in what Flynn calls an “uncontrolled environment.” In other words, unpredictable, often chaotic or unique factors outside the department’s control—the rise of a new type of particularly addictive prescription drug, a renowned mass murderer who just happens to live in the Oxford Apartments on N. 25th St.—can substantially increase categories of crime. Something as mundane as a severe winter storm can, conversely, significantly lower them.
“One of our key guys is Captain Jack Frost and we really count on him,” quipped Flynn, “and sometimes he comes through for us and sometimes that bastard doesn’t.”
The difficulty of quantifying when and how much Captain Frost pitches in helps illustrate one of the reasons value-added analysis per se is not currently used in police departments such as Milwaukee’s to isolate the contributions made by the divisions or individual officers. Flynn says that some police departments have brought in academics to parse factors that impact crime and ask the question, “Can we identify a police effect?” The answer: yes, but “less so in the broad sweep of crime trends” than in more specific circumstances. “Police,” he said, “can have an impact at a time and a place where there’s a problem that has a commonality.”
In other words, although cause and effect cannot be measured precisely in police departments, police can rightly take credit for a good, albeit not wholly quantifiable, portion of the steadily decreasing crime statistics in Milwaukee. And there is a firm belief among many in the department that the focus on data has made that possible in a very basic, consistent, frequent way.
Evaluations and Driving Performance
Data is not currently used in formal performance evaluations of individual officers, said Flynn, though it is “being used as a way to see that officers are properly supervised” and does have a direct impact on performance of individual officers.
“The evaluation systems are not particularly good here or anywhere. In many places, you can’t even use evaluations for promotions and transfers by contract,” he said. “It can be done here, but the performance evaluation process is so primitive that it’s not very helpful. What this nonetheless does is focus our commanders on their supervisors’ interventions with the worker bees so that we can account for the lowest quartile of any working groups. And that’s what I want. Someday, on the laundry list, will be better evaluations of individuals. But in the near term, I want to motivate teams and group of officers to be more effective.”
There are carrots in the department, which has instituted what Flynn calls a “pretty sophisticated awards process.
There are also sticks of a sort for both supervisors and officers.
“They get counseled because everybody knows the chief just heard you didn’t do any car stops last month,” said Flynn. “If that commander of that district is going to get up in front of his colleagues and say, ‘I don’t know why that guy didn’t do anything,’ well, they’re going to look stupid. I want the bosses to own the performance of their subordinates. It’s not always negative. Frequently, the guy with the zero, well, he was out sick. He had an operation.” Maybe he was involved in a community relations effort. But “the point is employees know that they’re being paid attention to. And that by itself can generate a certain level of performance.”
Asked if he would use data to gauge the performance of a district captain, he said he doesn’t have a mathematical formula. “But,” he added, “the data gives me a very good way of knowing, does that captain know his or her job? Do they know what’s going on in their district? I don’t expect them to cure every crime trend. … What I expect them to do is understand they have a crime trend and to develop a rational plan to deal with it. If the plan doesn’t work, that doesn’t bother me as long as they can account for the fact they implemented the plan and this is what they learned and now they’re going to try something else.”
The Trickle-Down Effect
CompStat’s success, the Police Foundation study pointed out, is dependent on many factors including how technology is used, management styles, a department’s culture, and, ultimately, whether it changes the routines of officers on the front lines. That doesn’t happen unless the officers themselves are aware of the data. In the Milwaukee Police Department, the officers in the squads have access to the same data, the same reports, and the same statistics as their superiors
“Everything we built,” said Inspector John Hagen, “we built for the squad car.”
Hagen has a computer in his office that enables him to select any geographic area in the city— large or small—and immediately get information on specific types of crime that have occurred there in the previous day, week, or month. The software also enables him to instantly click on reports written about those crimes and look for patterns. He can also plug in an individual officer’s number and see what
that officer has been doing. All officers on the street have the same ability, he said. That access at the street level can help foster both collaboration and, naturally, competition.
There is room for debate over the exact extent to which the Milwaukee Police Department has succeeded in using data to drive performance. But the structure to allow success—and, ultimately, accountability—clearly exists.
Data is an integral and driving factor in both significant and daily decision-making throughout the department. Everyone, no matter the rank, has access to the same data and the ability to use it to formulate crime-fighting strategies. Responsibility, decision-making, and problem-solving are all decentralized—but accountability is not. The chief of police himself and the top brass hold the district leaders accountable for performance on a daily basis. Results factor—albeit indirectly —into assessments of individual performance. Data, at the same time, is also used to foster collaboration, motivation, and recognition of achievement.
Almost none of that is true to anywhere near the same extent in the Milwaukee Public Schools.
Data and MPS
Wherefore Warehousing?
MPS has had a “data warehouse” for years. Lindsey calls it a repository of information used to produce, among other things, a daily superintendent’s summary report that includes facts about everything from attendance to suspensions to enrollment to withdrawals up to and including the prior day as well as year-to-date comparisons to the prior year.
MPS chief academic officer Heidi Ramirez says the data is used to ask—and seek answers to—questions every morning.
“One of the toughest things for us (when Thornton’s administration first arrived) was we wanted to know immediately just how many kids were in school that day and how did everything roll out, and who showed up, and were meals delivered on time, were buses running on time so we could reflect on that in real time,” she said. “And that was one of those things, frankly, that really bothered (Thornton), that, at the systems level, we did not automatically have the real data you would need. And Deb (Lindsey) and her team really heard that concern and went into overtime trying to make sure we were going to have that stuff and in as close to real time as possible.”
Data in the warehouse is also used to produce what they call “companion dashboards” that have been used by both district administrators and teachers in a variety of ways. One of those ways, for a while at least, was known as EdStat.
EdStat’s Rise and Demise
Lindsey, the MPS director of research and evaluation, sat in on a CompStat meeting in the Milwaukee Police Department and came away with the same fundamental observation most do: CompStat drives accountability.
Chief Flynn “permitted me and one of my colleagues to attend one of their crime stat sessions,” she said. “They present data on a number of key performance indicators in different (districts) across the city. So the session I attended, there were a couple of (districts) whose data were being presented, and there are very probing questions that the police chief and his team ask of the (district captains). … The captains are held accountable for, not just the crime rates in their (area), but their response to it.”
“If it’s your turn in the chair there in front of the police chief, you need to know your data well … but also be prepared to describe, ‘OK, if I’m aware that burglary is going up, these are the 12 things that we’re doing to address that.’ ”
Lindsey was instrumental in setting up, on a limited basis, something less ambitious but somewhat similar in MPS during the 2009-’10 school year: EdStat-i.e., “workshops” on the use of data. During EdStat workships, school leaders spent two hours each month reviewing “dashboard” data with their peers in regional clusters, discussed trends, identified discrepancies between targeted and actual performance, and shared possible strategies to address students’ needs. Special education supervisors, assistant principals and curriculum specialists participated in the same training in the afternoon. The ultimate goal was to identify students with academic, attendance, or behaviors issues—and find ways to drive change for the better.
“Accountability and Performance in Secondary Education,” a fall 2010 paper by Rob Meyer, Bradley Carl, and Huiping Emily Cheng, saw EdStat as a tool for data review and continuous improvement. By “providing a regular time for district and school staff to reflect on progress along these measures, the EdStat model provides a useful new way of incorporating data into the school improvement process in MPS,” they wrote.7
EdStat, however, proved to be very short-lived.
While “principals are still engaged in data discussions with their supervisors,” Lindsey said in December of 2010 that EdStat was no longer being used.
Asked in a different interview why, Ramirez, the district’s chief academic officer, demurred.
“I would say, depending what you mean by no longer done, the EdStat processes are still used,” she said. “If you mean EdStat as the designated two hours each month with principals, that is what is no longer done. One of the things we discovered pretty early on was that in some ways principals suffer from data fatigue but were not particularly skilled at the problem-solving piece of that.”
Discussions about data, Ramirez emphasized, are still taking place in a variety of ways: during meetings among principals at the regional level, for example, and during more informal one-on-one meetings between regional district leaders and principals. There are, district leaders say, also learning teams in the district with teachers and literacy coaches and math teacher leaders who discuss data. In addition, every Friday afternoon the superintendent meets with regional leaders and data is discussed there.
“This is not a CompStat process,” said Ramirez. “There are different kinds of meetings happening. Mostly they have one-on-ones or small group with either the superintendent or a regional (leader) or a phone call or follow-up, those kinds of things. And we look at the data of the week, where the superintendent meets with the regionals and myself and another chief every Friday afternoon and we look at the week and say, ‘OK, what’s the story here?’ I would not say the process is as formal as CompStat, but certainly we are looking at a variety of data.”
They might, for instance talk about suspension data, who’s “actually doing really well on this particular indicator,” and what they are doing exactly, said Ramirez. But there is a broader goal as well. She and Lindsey say there is now more discussion of how the data should change instruction in order to meet a “larger reform agenda” in the district.
Less clear is how frequently data discussions focus directly on student academic progress, and whether anyone other than the kids is ever held accountable.
Focus on Academics at the Student Level
Data is used to hold kids accountable. Teachers in selected schools, for instance, receive training for one hour each month in ClasStat, a variation of EdStat focused on classroom and grade-level data. Central office specialists work with teachers to determine when and how to modify instruction, intervene, and monitor the progress of kids who are struggling. It’s unclear exactly how many kids ClasStat impacts in the district, which has more than 80,000 students, or how often the specialists work with classroom teachers on data analysis. Lindsey estimates that it occurs “in many schools many times a day throughout the district,” but added, “I really don’t have a number for you.”
The bigger question, in the meantime, is how data on academic achievement drives change—or introduces accountability among teachers and principals and other administrators—in any systemic way.
The Broader View
Much of the data reviewed on a daily basis appears to revolve around basic issues like attendance —an enormous challenge in MPS.
District leaders resist any implication that attendance is not reflective of academic achievement.
Ramirez, in fact, calls attendance data “a pretty good indicator of instructional program quality” and a “pretty good sign of engagement of students.” Effective instruction, she says, “includes engaged students who are showing up on time” and signals that there is “a good climate for learning” going on.
That might be, but the fact that just getting kids to show up is apparently considered a measure of academic success demonstrates the overwhelming challenges MPS faces—and also raises questions about how much of the data focus is on helping higher-achieving students reach their potential and flourish.
An Essential-and All-Too-Rare-Question
MPS is by no means averse to the use of data and measurement.
Despite opposition, the Milwaukee School Board, in a series of 7-1 votes, adopted the new Balanced Assessment System in 2000 that greatly increased the use of standardized tests. That vote signaled a fundamental shift in student testing in the district. Much of what MPS does today, then again, is the result of laws and court decisions over the years.
For instance, the massive, multi-faceted, federal No Child Left Behind legislation of 2002—America’s most recent iteration of the Elementary and Secondary Education Act of 1965 (ESEA) —mandates that each state must determine whether each individual public school is making adequate yearly progress based on statewide proficiency standards. Each state has been required, over time, to implement yearly assessments in mathematics, reading, or language arts and, in some grades, science.
Those proficiency scores are used annually to determine not just how students are performing throughout America, but how the country’s individual schools are performing as well. MPS, as a result, now administers standardized WKCE tests in reading and math in grades three through eight and also grade ten. In eighth and tenth grades, the district also gives students WKCE tests in language arts, science, social studies, and writing. Moreover, the district doesn’t use the tests just to measure proficiency. It uses the same tests to produce value-added scores for each individual school.
Rob Meyer, head of the Value-Added Research Center in Madison and widely regarded as one of the pioneers in the value-added field, believes this is imperative. Meyer does not favor doing away with proficiency or what are sometimes called “attainment” measures—quite the opposite. He says it makes sense, though, to supplement them with value-added scores and suggests that value-added analysis can be used to drive proficiency levels higher and ask, in essence, “What do we need to do to get proficiency?”
MPS, which publishes both proficiency and value-added scores in school report cards each year, does ask that question at times—but not nearly as often or publicly or effectively as it could.
What Makes MPS-For Better and Worse-Different
William Sanders, a senior research fellow with the University of North Carolina and a senior manager of value-added assessment and research for SAS Institute Inc. in North Carolina, is often credited with first developing value-added measurements of schools when he worked in Tennessee in the early 1980s.
Milwaukee, as Rob Meyer says, is also an “origin story,” however. Meyer has been working with MPS for 15 years, and he measures value-added differently than Sanders does. Basically, said Meyer and Lindsey, Milwaukee’s value-added methodology takes into account, controls for, and separates out more of the outside influences on student achievement than Sanders’ model. According to Lindsey, it factors out socio-economics (i.e., the number of kids receiving a free or reduced lunch), disabilities, language issues, and ethnicity—things that are wholly outside the purview of the schools but that, she said, have been shown to have an impact on levels of student achievement. Some other districts control for fewer variables, some for more. In Madison, for instance, the school district also control for parents’ education level. MPS differs from some places not simply in how value-added analysis is done, however—i.e., what it takes into account and controls for—but what and who specifically it measures, or doesn’t.
Once a leader, it is in these areas that Milwaukee is now a laggard.
Granularity
MPS currently performs value-added analysis of each district school and uses the results to help determine where to intervene, and how. For instance, if a school is said to need improvement under NCLB proficiency standards, but is experiencing much greater growth than the district average, the district might decide it doesn’t “want to interfere with the good work that was going on in the school” and is less prescriptive than it might be with schools also identified as needing improvement that have lower growth, according to Lindsey.
In addition to measuring growth at individual schools, value-added analysis is also used in MPS to determine which grade levels within those schools are successful and which are not. If the fifth grade at a particular school is consistently a year of high growth, for instance, the district can take closer look to try to determine what is being done right in those classrooms. During school improvement planning times, according to Lindsey, teams get together and review the data, including both proficiency and value-added results, to determine which grade levels are consistently doing a good job and which are not—a process that can result in teachers changing curriculum and instruction methods.
MPS also has the data to perform classroom-level, value-added analysis and has, in fact, been conducting a demonstration project at that level for several years. The results, however, have not been widely discussed or used in MPS—unlike some other districts in the country that do now conduct value-added analysis of both individual classrooms and individual teachers.
“Ohio in particular has been doing value-added at the classroom level, providing teachers with value-added data,” said Lindsey. “And I have heard teachers, Ohio teachers, speak very passionately about how receiving information about the effects of their instruction has really been beneficial. I’m thinking back to a meeting that I attended that was sponsored by Battelle for Kids, which has provided a lot of the professional development on value-added in the state of Ohio. And a teacher received reports that showed how much growth her lowest-achieving kids got, how much growth her middle-of-the road achieving kids got, and how much growth her really high-achieving kids got. Because every teacher will tell you, ‘I’ve got some low kids, I’ve got some high kids, I have a bunch of kids in the middle.’ They try to reach all the kids equally, but the truth is most teachers are particularly skilled at either reaching the middle, the high kids, or the low kids. And most of them aren’t as skilled at reaching the full spectrum,” said Lindsey.
“That’s not to be critical of teachers but, I mean, everybody’s different and everybody has different strengths. And this teacher spoke about how, (when) she got the reports about how she differentially affected the growth of different kinds of kids, she was really shocked. And so what she did is she took her report and contrasted that with reports of other teachers in her building to say, ‘OK. My reports show that I’m pretty good with my low kids, and I’m even better with my middle kids. But I’m not very good with my really high-fliers.’ So she found other teachers who were really good with high-fliers, and conferred with them about kinds of practices they used to better meet the kids’ needs who are really high-achieving,” she added.
Ideally, the use of value-added fosters both collaboration and self-improvement—but both are limited without value-added data at the teacher and classroom level.
Subject Areas
In MPS, as in most districts across the country, value-added methodology has been used to analyze the results of standardized reading and math tests given to students each year—the same test scores used to satisfy the proficiency reporting requirement of NCLB. This means that value-added analysis is not possible for the majority of teachers in the majority of subject areas. This is typical, but some places in the United States are moving quickly toward using value-added analysis for all teachers.
The Hillsborough County Public School District in Florida is one such area. In the summer of 2010, the Hillsborough schools, a behemoth district that includes more than 240 individual schools in and around Tampa, hired the Value-Added Research Center in Madison to use value-added analysis to determine the contributions of all teachers in all subjects. According to David Steele, chief information and technology officer in the district, VARC is being paid $3.4 million to develop value-added scores in all academic and non-academic areas, including, for instance, areas such as auto mechanics.
The extensive use of value-added analysis is possible because the district is developing at least 600 assessments for various classes—a number that Steele indicated might be a conservative estimate. The district is just starting to crunch the numbers and expects value-added scores for individual teachers to eventually comprise 40% of teacher evaluations that could be used to help determine everything from tenure to raises to promotions and dismissals.
Grade Levels
Value-added analysis, because it relies on WKCE tests that are administered only in grades three through eight and grade ten in MPS, is not performed at the high school level. This is a significant hindrance in trying to determine which high schools are failing—and one that has very real consequences.
Greg Thorton’s Losing Battle
MPS has been shrinking, and struggling, for decades. There were more than 133,000 students in the district in 1970. Today there are about 50,000 fewer. Many schools—traditional and charter operations alike—have been shut down amid criticisms that the board, in so many ways, simply hasn’t acted fast enough. Between September and December of 2009 alone, Thornton’s predecessor, William Andrekopoulos, recommended closing as many as 20 schools, the Milwaukee Journal Sentinel has reported; the board closed only five.8
MPS has more than 180 different schools, and Thornton has chosen far fewer battles. His failure to close down just one of them—the School for Urban Planning and Architecture—provides a useful example of why it is so difficult in MPS to take even a small step toward pulling one of the lowest-performing school districts from the bottom of the heap.
SUPAR is a small, MPS charter high school that, according to Thornton’s data, has been failing badly for more than three years. Data that Thornton presented to the school board during an emergency review of the school’s contract in late January depicted exceedingly low levels of student achievement in a school with myriad problems. Average daily attendance hovers around only 70%. Standardized test scores, meanwhile, are abysmal. Only 18% of sophomores are proficient in math or English/language arts, according to state tests given during the 2009-’10 school year—well below MPS averages that are themselves deeply troubling.
“We know we can provide a better option for these young people,” Thornton told the school board that evening, “and I am asking the board to approve it.”
Forty minutes later, Thornton got both a “no” from a micromanaging, often emotion-driven board that lacks focus, and proof of several other reasons he appears destined to fail: conflicts over the true nature of the district’s many charter schools and legitimate questions about the quality of the district’s data and how and when it is used.
The board’s decision to rebuff him and give the school yet another chance affected only about 100 students. Just how and why board members did so, however, illustrates why Thornton faces a Herculean struggle to improve the lives of a generation of MPS kids who, far too often, can’t even read and write.
Thornton did not make the recommendation to shut SUPAR down lightly. A charter school review team that included MPS board member Tim Petersons also determined that the school, based on its failure to meet educational goals, violated its contract. Nobody on the board disputed that. A majority, however, felt that failure didn’t really matter. Board member Peter Blewett, a lecturer in the UW-Milwaukee English Department, informed Thornton that closing the school “is not about numbers.” It is “about people’s lives.” He wanted to know if Thornton had polled the parents, said he needed to know what the teachers and students were thinking, and suggested that he didn’t believe it was his place to tell people what school they could choose. Board member Terrence Falk—a former MPS teacher—suggested that Thornton’s administration and the board itself were partly to blame for SUPAR’s shortcomings, even though the school is an instrumentality charter school that is supposed to be autonomous.
Thornton was clearly irked the night of the meeting by the board’s muddled view of charters. But he was also plainly frustrated by the board’s resistance to using data as a measure of success. The superintendent noted that SUPAR parents, teachers and students had all been given an opportunity to weigh in. But, he added, “if we’re going to reduce ourselves to parental vote and teacher vote we will never close a school in the Milwaukee Public Schools, and I think that is unfair to the children. I think it is unfair to the city.
“If we’re going to govern by votes of individuals and not make the best decisions that I think we’ve all been entrusted to, then I think we will continue to sit in one of the lowest positions in America with respect to student achievement—and I am concerned about that, totally, totally concerned about that.”
Thornton, who did not respond to an interview request, clearly sees himself as a modern manager reliant on data and willing to make some hard, unpopular decisions. His problems, however, go much deeper than just convincing some wayward board members to use data as a measurement tool. One board member, Bruce Thompson, clearly believes in using data. He also believes the administration’s data isn’t very good.
Like other Wisconsin schools, MPS uses the Wisconsin Knowledge and Concepts Examination tests to measure student proficiency. The tests are mandated by law and given to all students in reading and math in grades three through eight and also in grade ten. They are, however, seen by many as a misleading measure for the simple reason that many students, particularly those with troubled family backgrounds, start with low scores. That’s why MPS also uses value-added analysis to measure the contribution that its elementary and middle schools are making toward student growth. Unfortunately, MPS—for reasons that predate Thornton—does not perform value-added analysis of high schools like SUPAR. The data regarding SUPAR students, said board member Thompson in an interview, simply “was not rich enough.”
It’s a very real problem—but, as Thornton found out, just one among many. Blewett made a motion to let the school stay open and prevailed that night. So, despite its failings, SUPAR will remain open until at least spring 2012.
Impediments to Better Data Use in MPS
Resistance to data usage can stem from fear of everything from elimination of discretion to loss of power to loss of income or even employment. MPS, in particular, faces some other impediments that must be overcome or counteracted if the district is to be successful. Some of these issues were evident in the SUPAR debate.
Leadership
Ed Flynn, a high-profile leader who clearly has the support of both a mayor who gives him a lot of latitude and a relatively powerless Fire and Police Commission, is an example of what a strong, focused leader with support can accomplish.
MPS, conversely, is essentially run by a school board of often conflicting and micromanaging personalities as well as a new superintendent, Thornton, who is still largely unknown and is rumored to be a short-timer. Thornton has signaled that he greatly values data and measurement and wants to use it to make decisions—but he will not have an easy time of it. A strong leader tethered to an unfocused school board is not, unfortunately, likely to remain a strong leader for long.
At least one board member, Jeff Spence, thinks Thornton is frustrated by the school board’s propensity to micromanage, and he shares that frustration.
“You hire a guy,” he says. “You give him a lot of money. Let him go” and do his job. “And then hold him accountable.”
Of course, it’s hard for the board to hold the new boss accountable for improving the schools when time and again it shows itself more concerned about protecting the status quo.
Old Data
The Milwaukee Police Department has one huge advantage over the Milwaukee Public Schools. Every day, it is able to focus on data that is both relevant and just hours old.
Looking at crime data that is even a couple of months old—something the department used to do —“was like an astronomer looking at a distant star,” said Flynn. “The light was emitted a million years ago. What does that tell me now?”
Having fresh data, conversely, can have an immediate daily impact and also provide an organization with what Flynn calls “an organizing principle.”
MPS, in contrast, has lots of data. But it is often the wrong kind.
Standardized WKCE tests are given annually in reading and math but not at the high school level or prior to third grade. In addition, the results of WKCE tests that are given each November are not back until the spring, six months later—a widely acknowledged problem. Another type of test—the MAP tests—could be a step forward because they provide more frequent, recent data. But there is resistance in the district to using them as an accountability tool.
Resistance to Accountability
The Milwaukee Public School District does much more testing now than it did in past decades, or even last year. It has to.
As the result of a special education lawsuit, in July 2010 the district adopted a “universal screening measure” called Measures of Academic Progress or MAP. MAP is a so-called adaptive test, meaning students take it online and questions vary depending on prior answers. The questions adjust in difficulty depending on the responses so it’s easier to pinpoint true ability both in kids with very low and very high achievement capabilities. The results are also available almost immediately, which is essential if the district and its teachers are to react quickly.
Beginning in September of 2010, MAP tests were given in reading and math to students in kindergarten through eighth grade and to many, though not all, high school students in MPS. The tests were given again in the winter and spring. Ramirez says the district has “communicated the expectation” that next year all schools will administer the MAP tests.
“Particularly now with the MAP assessment, teachers are really looking at their student performance data” frequently, said Ramirez. “Even though the test is only administered three times a year, people are going back to those data an awful lot because of way the data are reported.” Results are used, she said, to plan instruction.
As importantly, according to Lindsey, the district has “begun an initial foray into using MAP data for value-added” analysis. The Value-Added Research Center, according to Lindsey and Ramirez, has figured out “growth targets” for the schools and some grades within schools based on how they performed on the MAP in September. Every school, in addition, has been given goals about where they should be in winter and spring.
“They already have those goals,” said Ramirez, “and are working toward them.” They are, she said, “looking at the data to see did we beat, meet, exceed, struggle to get to our MAP goals, and what do we need to do differently to get there.”
Ramirez concedes the MAP results and goals could be used as an accountability measure. But, she said, they won’t be.
“I would not say that it is not possible,” she said. But it “is not what, one, MAP was originally designed for so you always have validity issues there in terms of a test should be used for that which it is designed. And two, we’re new enough to MAP to sort of not know if this is appropriate for us to use. And three, we already have a very solid sort of accountability metric,” an apparent reference to the WKCE scores.
“We have really been meaning to use these (MAP results) as formative data different from the WKCE which obviously is an accountability instrument or measure,” she said. “The MAP data and these benchmarks are meant to help support the schools and the support system here centrally and in the regions. And so I am always careful to say these are not at this point data that are ready to be shared. … They really are designed to help move all of us and get smarter and inform our practices.”
Bottom line, using value-added MAP analysis as a way of holding teachers and principals and administrators accountable for the success of a school is not something Ramirez seems to envision.
“No, we are not using them for accountability for district schools right now and that is not their intended use,” she said. “The MAP is not designed as an accountability measure.”
While, when pressed, she conceded that using MAP results for accountability might be something to “to think about,” she also said, “We need more focus on where we are headed and how to improve than we do on targeting folks who are not there. I think we have enough pretty solid data to know who is not there and I think, frankly, that there are a lot of folks who feel that they have been beat up on quite a bit already because of accountability. But we have not done as good a job laying out the instructional vision, the improvement agenda, and providing folks with resources to actually take action to make changes.”
Asked, finally, about using MAP results to make decisions about closing schools like SUPAR, she responded, “What I can say to you again is that right now, our most urgent need in terms of looking at data is around actually driving change in instructional practice and that that is the focus of the MAP work for us right now in the district.”
Culture
Accountability is a word that is often taboo in MPS. But there is another fundamental problem that seems to be inherent to the culture of the district. There is often little sense of urgency, and process frequently overwhelms results.
An example:
In late September 2010, MPS was awarded a Teacher Incentive Fund grant that will be used to implement a program known as TAP that uses both value-added analysis and classroom observation, in part, to evaluate and reward teachers in schools with low student achievement. Because of that, the $7.6 million MPS grant, both in district-generated reports and in the mainstream press, has been portrayed basically as a performance-based teacher compensation or bonus program.
Performance bonuses are, in reality, a relatively small component of what the grant will be used for. Most of the grant money, according to district documents obtained through an open records request, will actually be used to create new positions with traditional salaries and benefits, and to pay consultants and travel costs. There is much about the plan, in fact, that sounds old and familiar and relatively little that sounds new.
Months after the grant was announced, much was still unclear about how the grant would be used—including which schools might be part of the program. An MPS “narrative” of the program did, however, provide at least a general overview. According to the narrative: The district has hired a full-time project coordinator, Paul Kroog, and plans to also hire a full-time “executive master teacher.” They will use much of the grant money to gradually, over a period of five years, help set up “leadership teams” in 12 of the district’s 180 or so traditional schools. The teams will conduct classroom observations of, and provide extensive training and support for, other teachers.
It’s possible that additional money could be added. But well over $4 million of the initial $7.6 million grant will be used to pay the salaries and fringe benefits of the full-time project coordinator and an “executive master teacher” and, in individual schools, stipends or salary increases for “master” and “mentor teachers.” Over the five years of the grant, another $332,000 will be spent on travel for the leadership teams and other teachers to attend conferences and meetings. And another $970,000 will be spent on outside contractors and technology upgrades. In other words, district documents suggest, a whole new infrastructure will be set up with new personnel paid in a traditional, predetermined way. Of the $7.6 million, only $1.65 million – 22%—will actually be spent on monetary, performance-based awards for either principals or teachers, in the meantime, according to budget documents.
According to the project narrative, there will be some focus on both individual achievement by teachers and administrators and, reportedly, on data.
The master and mentor teachers, for example, will work with both individual colleagues providing classroom-based, ongoing coaching and feedback, as well as with “clusters” of teachers in certain grades or subjects “several times a week to review data and collaborate.” But it appears that the use of data to gauge performance will be limited. Fully half of each teacher’s and each administrator’s evaluation will be based on classroom observations, for instance. The other half of the teacher evaluations will be based on value-added analysis—but not usually of each individual teacher’s or administrator’s performance. For teachers in many subject areas, the rest of their evaluation will be based on school-wide value-added results.
Finally, the grant will not have a widespread impact. Teachers in the schools that participate will be eligible for the bonuses that, for some, could be $3,000. Principals will be eligible for performance bonuses of up to $10,000, according to a narrative describing the grant. Total performance awards could amount to about $1.65 million. That is a tiny amount in a large district with an annual budget of approximately $1.3 billion.
Karen Jackson, the district’s director of human resources, said that TAP will be about more than compensation, and that the hope is that it will create a “different paradigm” that includes professional development, training, and new career paths. Less clear is the extent to which the grant will encourage accountability or when the schools taking part might be selected.
In sum, there appears to be little hurry. The grant was awarded in the fall of 2010. The first year of the five-year period is being devoted entirely to figuring out how the program will work. No performance grants will be made until the second year and even then they will be small. Most of the money will, in the end, be spent on new positions and fringe benefits, travel and consultants—things indirectly related, at best, to the core objective of making kids smarter. The grant program also appears to reflect, in addition, an embedded belief in collaboration and consensus that, while often helpful, can delay decision-making and progress when taken to an extreme.
The culture of the police department is not only much more oriented toward results and individual accountability, it is oriented toward decisions.
“You go to an organizational meeting, and after about an hour the cops are looking at their watch and it’s time to go,” said Flynn. Cops are “decisional. They are oriented toward making decisions and doing something because starting at age 23 you are deciding things. You’re by yourself in the middle of a mess and everybody’s screaming and somebody’s got to come up with a provisional solution and it’s you telling the 40-year-olds what to do,” said the chief.
Union Opposition
The TIF grant—how it came about and the slow pace of determining how it might be used—is instructive. Not only did the union that represents Milwaukee teachers decline to participate in the application, it could in myriad ways water down the way it is implemented so that individual teachers are neither rewarded nor held accountable.
The Milwaukee Teachers’ Education Association’s recalcitrance has been overt. The MTEA declined to take part in the grant application process and did not have a positive reaction when the grant was, nevertheless, awarded. In an interview with the Milwaukee Journal Sentinel, MTEA President Mike Langyel equated pay-for-performance programs to “chasing test scores with dollars” and added that this “is not an effective way of improving teaching and learning.”9
Still, the same day the grant award was announces in September 2010, Jackson was quoted as saying that the grant was an opportunity to “work in consensus” with the union and the Administrators and Supervisors Council to figure out how to proceed.10 The answer: slowly. District and union leaders explained during a conference call in early 2011 with WPRI that it hadn’t yet been determined which schools would be part of the program because 70% of staff members in individual schools had yet to vote to accept or reject the use of TAP. One union leader added that the MTEA planned to go into schools and answer questions from teachers before votes were held and that there could “possibly” be some votes within a month or two.
Jackson, for her part, said her intention is to have the program up and running in some schools by the beginning of the 2011-’12 school year, although the exact structure has not been determined.
“We have a grant and it is our intention to implement it,” she said. “But we are going slow to make sure we know what this is.”
“I don’t know what the end product will look like,” she said.
While it appears there will be more time for collaboration and professional development and more jobs as a result of the grant, it remains to be seen whether that will translate into greater accountability, better problem-solving or increased student performance, or how quickly a program with a very small budget in 12 schools could ever be expanded to the entire district. Given the slow ramp-up of the grant program, it will be years before it will be possible to determine whether the program increases teacher accountability or student achievement and if not, why not.
Union opposition is not unique to the Milwaukee Public Schools. Within the police department, there has been, according to Flynn, a “little bit of pushback” from the detective division among some who “really hate that we’ve made the bureau very, very accountable. Not all of them by a long shot but, you know a few of them,” some of whom were elected to the executive board of the union.
Union opposition to the use of data in the Milwaukee Police Department, at the same time, appears to stem from more than a simple resistance to accountability.
Focusing on data and, by extension, core goals necessarily means a shift in resources and power. Since Flynn arrived, the role of the patrol division has been significantly enhanced while the number of detectives has been reduced. There has, as a result, been a cultural shift.
“This department was a detective culture department,” he said. “That’s where the chiefs came from, that’s where the secrets were kept, that’s where the overtime was made, and that’s where nobody asked questions about what they were doing as long as they got results,” he said.
“But the resistance—you know, you’ve probably seen this in other governmental entities—the fight is over this thing that is really about how we think you’re treating us.”
Changing the power structure will not ever be easy in any large, public-sector, highly unionized organization, but that is only one of numerous impediments in MPS.
Structure
Flynn has set up a system that is relatively simple and straightforward. Daily meetings keep managers focused on the most important objective. At the same time, the process does not appear to significantly reduce the amount of time patrols spend doing their jobs.
MPS—in just the small TIF grant—appears more apt to create a Rube Goldberg device that might only tangentially impact achievement. The EdStat program showed promise but, even before it ceased, was far from a daily or even weekly meeting capable of continuously focusing attention on useful data and key objectives. It’s difficult to ascertain the impact of the myriad meetings or processes that appear to have replaced it—especially since talk of accountability is not always welcome.
The impediments are significant: lack of board leadership, old data, resistance to accountability, culture, union opposition and structure. And yet, there is hope.
Conclusion
MPS is widely acknowledged to be in crisis. Crisis can prompt change. A McKinsey report, “How the World’s Most Improved School Systems Keep Getting Better,” notes that school districts that have ignited change have all done it in the wake of either crises, a high-profile report or a new, energetic and visionary leader.11 Of the three, having a new leader is the most important. MPS, in Gregory Thornton may well have that. But it also has myriad problems and obstacles that are impeding him.
MPS does not operate in a vacuum. It is often influenced by both litigation and federal and state legislation and initiatives.
At the federal level, NCLB may soon be reauthorized in a new form. In July 2011 at the state level, in the meantime, Gov. Scott Walker and Department of Public Instruction Superintendent Tony Evers announced a joint effort to work with educators and policymakers to devise a new statewide “growth-based accountability system” for student and school performance in Wisconsin.
The Wisconsin Department of Public Instruction is also working separately with the governor’s staff and other education leaders on an Educator Effectiveness Design Team that is developing recommendations for an evaluation system for teachers and school administrators.
The Department of Public Instruction says it wants to develop a “data-driven approach” to measuring student achievement and ensuring “we have the best, most effective educators in our classroom.” According to DPI communications officer Patrick Gasper, the department is working, among other things, to design a new “online, adaptive next generation assessment system that provides real-time data to teachers and parents,” and to develop an “accurate, cutting-edge educator effectiveness system that incorporates student achievement data, ensuring Wisconsin has the best and brightest teachers and principals.”
“Some of the best work in this area is being done in Milwaukee,” stated Gasper, and DPI believes that “the efforts in MPS will,” in fact, “be useful in informing our statewide educator effectiveness design team” charged with coming up with a new teacher and administrator evaluation system in the state.
DPI, in reality, might want to take a very close look at Milwaukee’s use of data — and why other institutions use it more effectively — before using it as a model.
Thornton appears to have good instincts and is trying to use data to drive change. Still, MPS has a fundamental lack of focus. Instilling accountability will require a structural and cultural transformation similar to the one the Milwaukee Police Department has undergone — one that revolves around measurable objectives. That, in turn, will require stronger, bolder leadership, not only better, more-frequent tests but a willingness to use them to make teachers and administrators accountable, a sense of urgency, rewards and recognition for those who are effective and consequences for those who are not, and — perhaps most importantly — a renewed belief in the power of individual teachers to make a difference in a measurable, meaningful, lasting way.
The resistance in some quarters to being held accountable for test scores is understandable. As Meyer puts it, the mandated use of NCLB proficiency indicators are “extremely antiteacher” in urban school settings where low scores have much to do with outside factors. Urban districts, where unions are often particularly strong and monolithic, need to do more to show teachers that value-added is, as Meyer says, “this conceptual tool which allows teachers’ performance to shine.”
Good teachers and administrators — like good cops — can make a fundamental and measurable difference. But MPS must find a way to hold them accountable if the good ones are to, as Meyer says, shine. There are many steps that must be taken along the way if that is to happen, but placing data at the center of both the organization and its culture must be the first.
Endnotes
1 Ben Posten, “City crime numbers continue downward trend,” Milwaukee Journal Sentinel, Aug. 19, 2011, online.
2 James J. Willis, Stephen D. Mastrofski, David Weisburd, “CompStat in Practice: An In-depth Analysis in Three Cities,” Police Foundation, 2003.
3 From the minutes of the May 30, 2002, MPS School Board meeting discussion of a “District Accountability System.”
4 Failing Our Kids: Why the Testing Craze Won’t Fix Our Schools, “A Glossary of Useful Terms,” Rethinking Schools Ltd., 2000, p. 140.
5 Mike Johnson, “MPS committee puts brakes on testing plan,” Milwaukee Journal Sentinel, Oct. 11, 2000.
6 Mike Johnson, “School board expands standardized testing, MPS change will bring tests to all grades, including kindergarten,” Milwaukee Journal Sentinel, Nov. 1, 2000.
7 Robert Meyer, Bradley Carl, Huiping Emily Chang, “Accountability and Performance in Secondary Education in Milwaukee Public Schools,” Volume II, The Council of Great City Schools, Fall 2010, p.8.
8 Becky Vevea, “MPS’s Vel Phillips school is targeted for closure, some parents say it was never given a chance to succeed,” Milwaukee Journal Sentinel, Dec. 15, 2010.
9 Becky Vevea, “Teacher bonus grant shrinks. MPS will work with unions to implement,” Milwaukee Journal Sentinel, Sept, 25, 2010.
10 Ibid.
11 Mona Mourshed, Chinezi Chijioke, Michael Barber, “How the World’s Most Improved School Systems Keep Getting Better,” McKinsey and Company, p. 91-97.