By the numbers
Electric vehicles have been increasingly visible on roads, both due to consumer preferences and to government incentives aimed at influencing those preferences. According to the U.S. Department of Energy, there has been an increase in the percentage of cars on the road that are all-electric. This number, however, remains minuscule in comparison to the number of vehicles with internal combustion engines. We graphed the Department of Energy data for neighboring states and some selected others to see how Wisconsin stacks up.
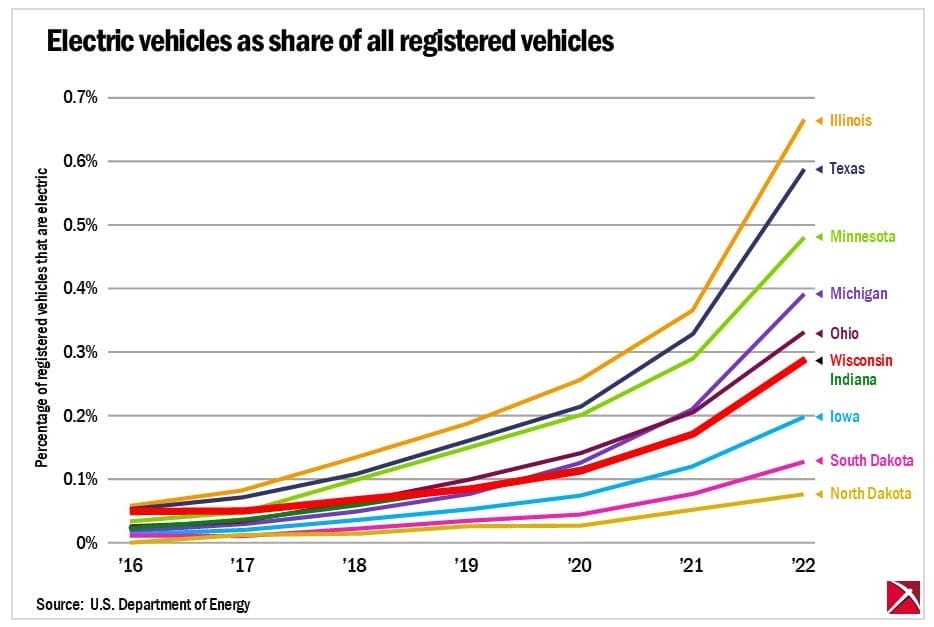
Comparatively colder states, such as North and South Dakota, have a significantly lower rate of adoption of electric vehicles. Wisconsin’s rate of adoption is almost identical to Indiana’s.
One factor that could be affecting the picture is an outdated Wisconsin law restricting electric automakers’ direct-sales business model.
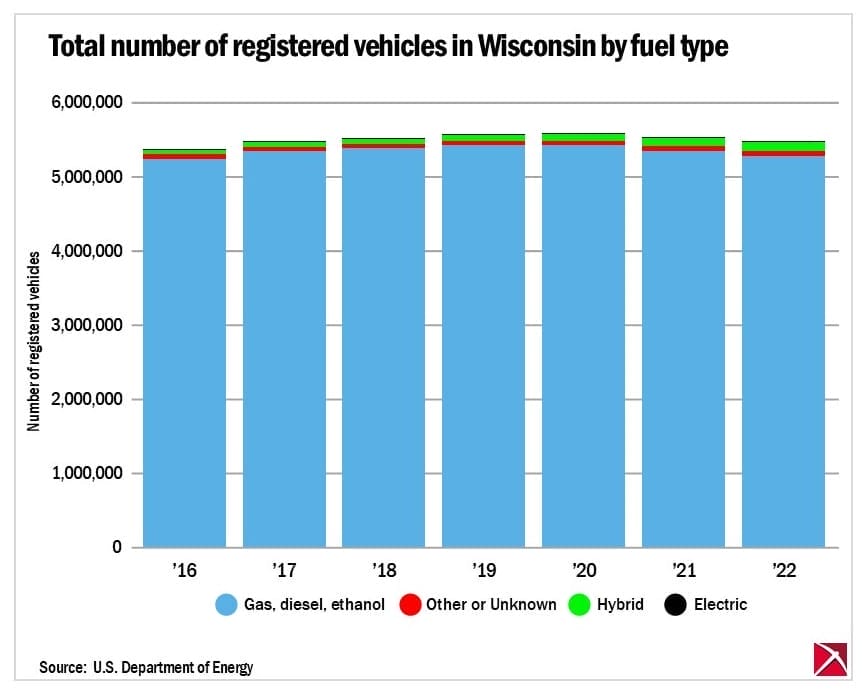
At the top of each bar, the thin black line represents the percentage of registered vehicles in Wisconsin that are electric. The figure is increasing, but it is still insignificant in comparison to internal combustion cars fueled by gasoline, diesel or ethanol.
The underlying numbers
| Percentage of registered vehicles that are electric | |||||||
| 2016 | 2017 | 2018 | 2019 | 2020 | 2021 | 2022 | |
| Wisconsin | 0.05% | 0.05% | 0.07% | 0.08% | 0.11% | 0.17% | 0.29% |
| Illinois | 0.06% | 0.08% | 0.13% | 0.19% | 0.25% | 0.36% | 0.67% |
| Indiana | 0.02% | 0.03% | 0.06% | 0.09% | 0.12% | 0.17% | 0.29% |
| Iowa | 0.01% | 0.02% | 0.04% | 0.05% | 0.07% | 0.12% | 0.20% |
| Michigan | 0.02% | 0.03% | 0.05% | 0.08% | 0.12% | 0.21% | 0.39% |
| Minnesota | 0.03% | 0.05% | 0.10% | 0.15% | 0.20% | 0.29% | 0.48% |
| Texas | 0.05% | 0.07% | 0.11% | 0.16% | 0.21% | 0.33% | 0.59% |
| North Dakota | 0.00% | 0.01% | 0.01% | 0.03% | 0.03% | 0.05% | 0.08% |
| Ohio | 0.03% | 0.04% | 0.06% | 0.10% | 0.14% | 0.20% | 0.33% |
| South Dakota | 0.01% | 0.01% | 0.02% | 0.03% | 0.04% | 0.08% | 0.13% |
| Total number of registered vehicles in Wisconsin by fuel type | |||||
| Gas, diesel, ethanol | Other/Unknown | Hybrid | Electric | Total | |
| 2016 | 5,234,100 | 67,300 | 64,300 | 2,600 | 5,368,300 |
| 2017 | 5,338,600 | 62,500 | 70,600 | 2,800 | 5,474,500 |
| 2018 | 5,374,600 | 58,500 | 75,400 | 3,700 | 5,512,200 |
| 2019 | 5,422,300 | 55,400 | 81,500 | 4,700 | 5,563,900 |
| 2020 | 5,425,500 | 50,600 | 88,400 | 6,300 | 5,570,800 |
| 2021 | 5,338,900 | 70,500 | 101,200 | 9,300 | 5,519,900 |
| 2022 | 5,271,600 | 73,700 | 115,200 | 15,700 | 5,476,200 |
Submit a comment
"*" indicates required fields
