2022 drop still leaves crime levels in city well above those as recent as 2019

When Milwaukee’s year-end crime figures for 2022 were released, Mayor Cavalier Johnson and Police Chief Jeffrey Norman touted their success in lowering crime levels. Johnson said, “There were some very positive trends that emerged in 2022, but I’m not here to celebrate.” Norman echoed that by saying, “I’m pleased to report overall violent crime within the city is down 7%. Again, overall violent crime in our city is down 7%.”
Although cautious in their optimism, both leaders are misdirecting Milwaukeeans about the state of public safety in the city.
Milwaukee is significantly less safe than it was a short time ago.
Milwaukee violent crime and property crime
First, overall reported crime is down from 2021 levels. Part I offenses, the most serious crimes, fell from just over 34,000 to roughly 29,000 — a nearly 15% decline.
But that is misleading because 2022’s lower levels are relative to 2021’s abnormally high incidence of crime. In other words, you might lose elevation descending a mountaintop, but you had to climb to get to that altitude.
In fact, compared to 2019, overall crime in Milwaukee is up 22.6%, with violent crime up 15.6% and property crime up 26% from three years ago.

Even accounting for last year’s drop, some serious crime categories have spiked since 2019:
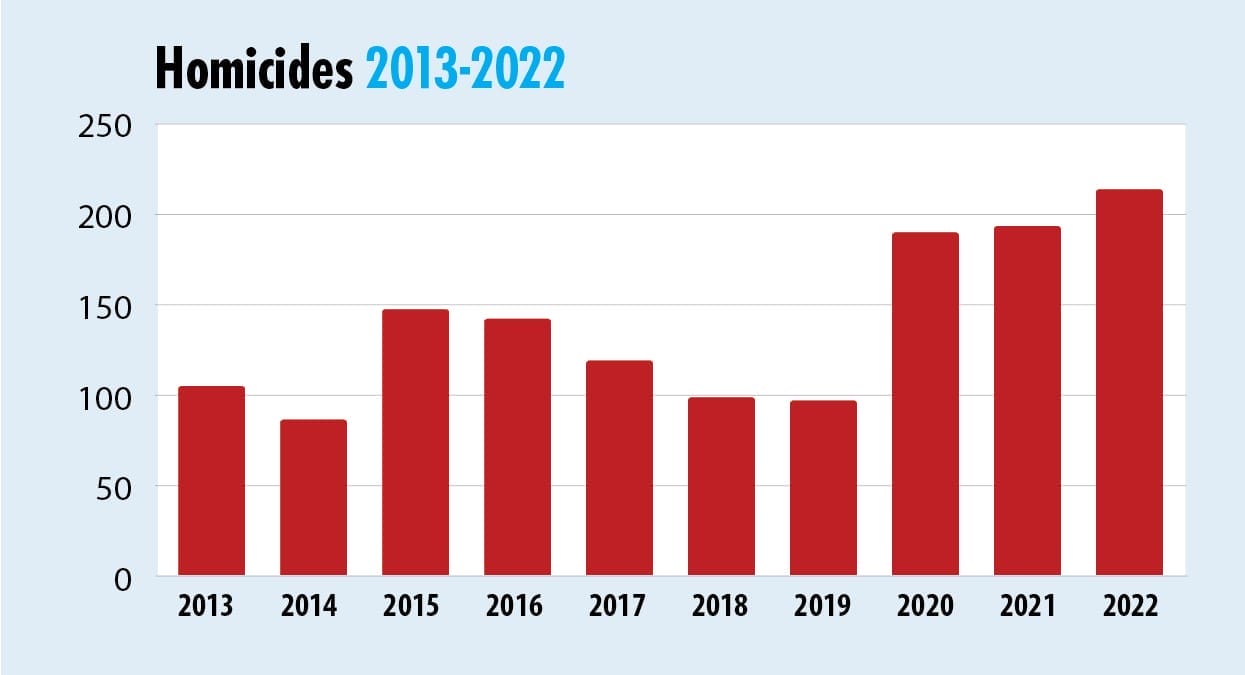
- Homicides have more than doubled (up 121%) and were higher in 2022 than in 2021.
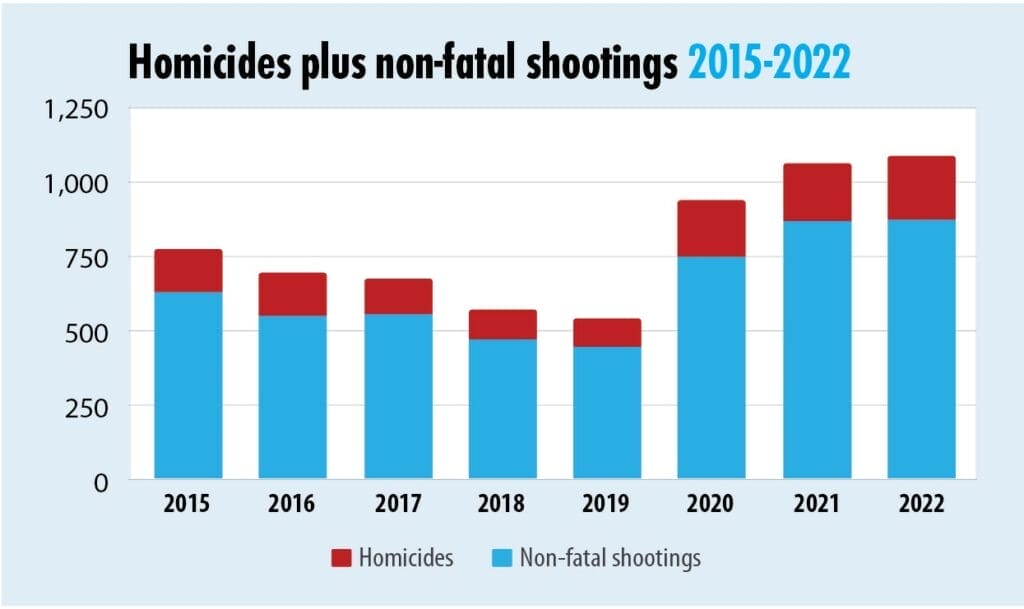
- Non-fatal shootings jumped from 444 to 877 (up 98%) and were higher than 2021 totals.
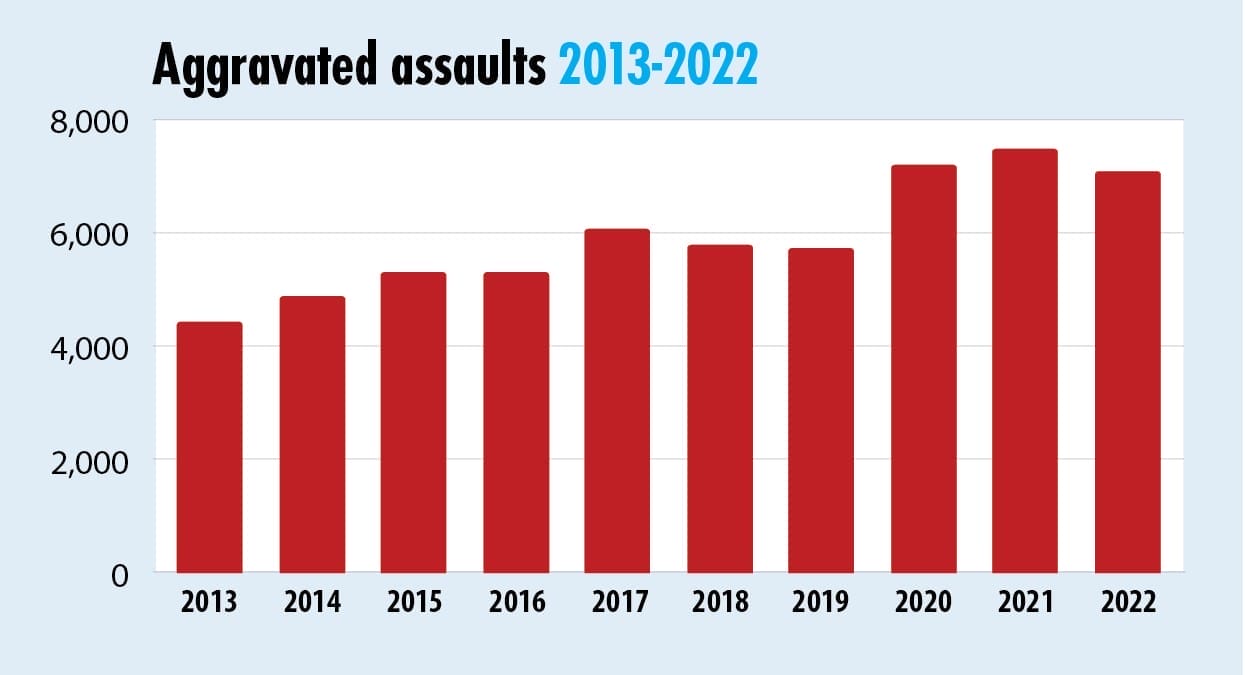
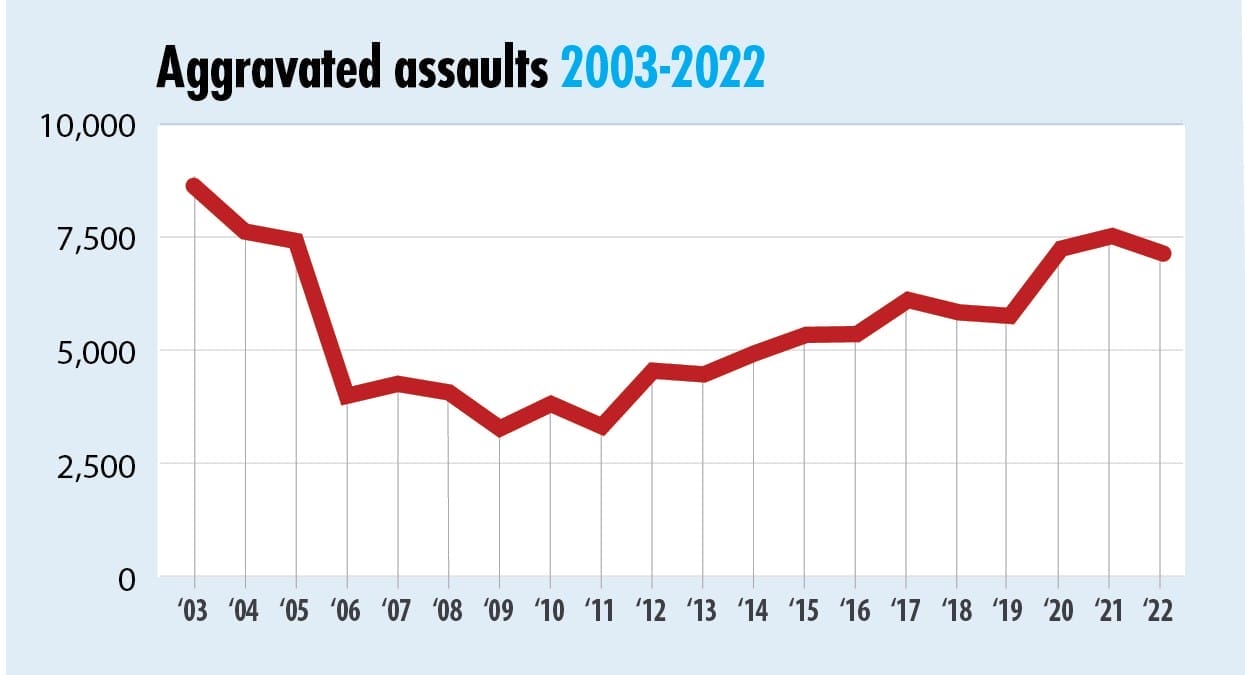
- Aggravated assaults (inclusive of shootings) rose 24%.
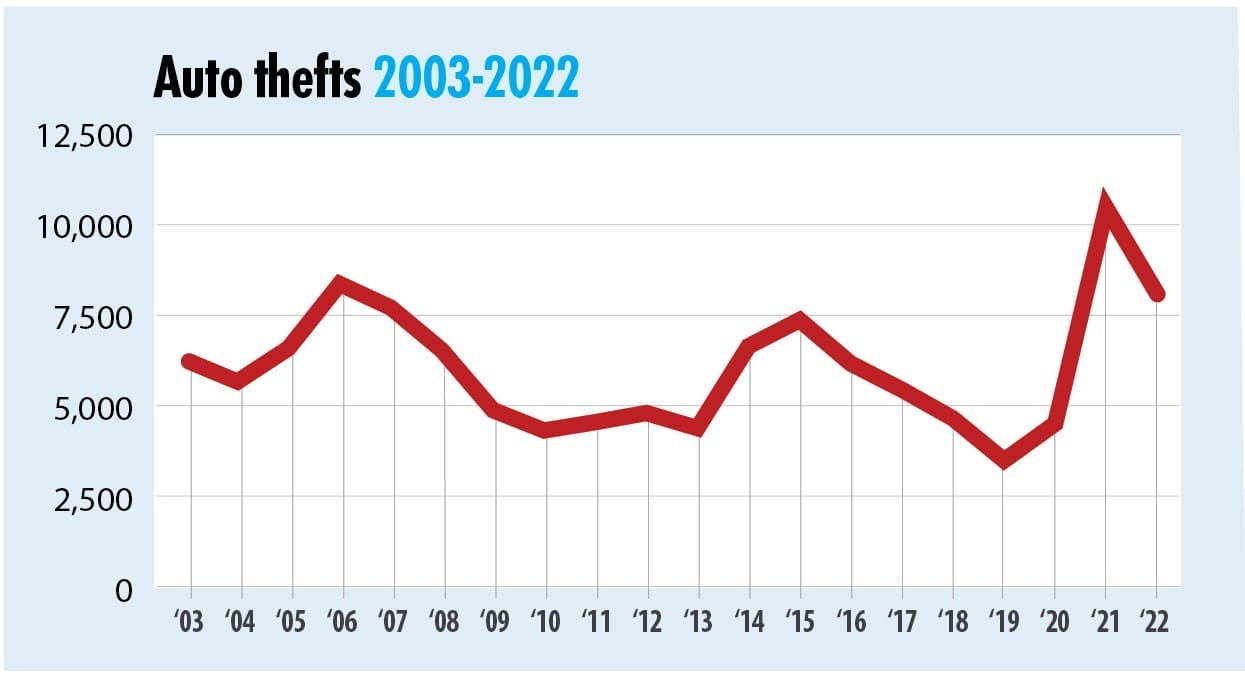
- Auto thefts increased 132%.1
- Larceny-thefts rose 9%.
Because not all offenses are created equal, it’s worth examining what “total crime” comprises, since these figures can obscure more than they illuminate.
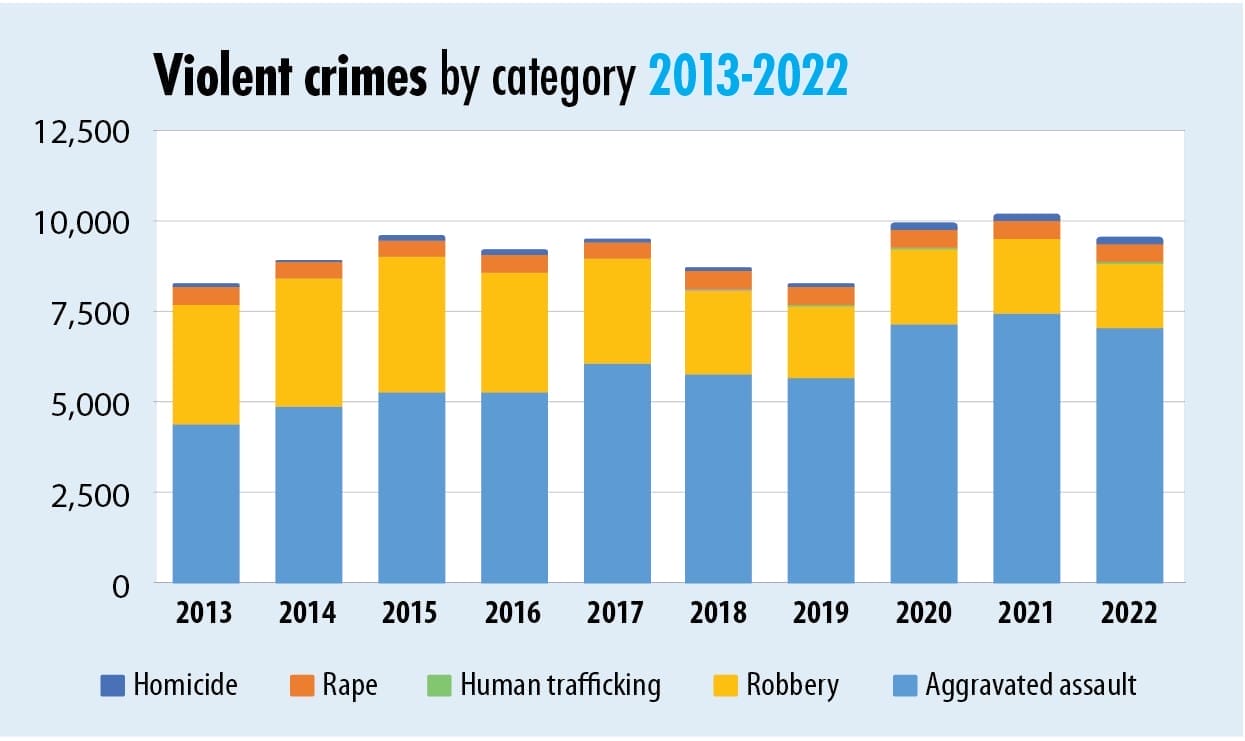
The total is made up of two categories: violent (murder, rape, robbery and aggravated assault) and property (burglary, theft, auto theft and arson). Violent crime fell 6.3% from 2021 to 2022, less than the 7% Chief Norman claimed — about 650 fewer offenses. Meanwhile, total property crime dropped 18.4%, or nearly 4,400 fewer offenses.
But the total volume of property crime dwarfs the amount of violent crime that occurs. There are far fewer fatal shootings every year than car break-ins. Lumping all crime types together — specifically, property with violent crime — obscures the severity and impact of crime in Milwaukee.
Between 2003 and 2012, violent crime averaged 21% of the total number of crimes reported but steadily rose as a share over the following decade (2013-2022). The violent offense share reached a high of 37.4% in 2020 — meaning violent crimes made up almost four in 10 reported offenses in the city — because the volume of certain property crimes fell dramatically.
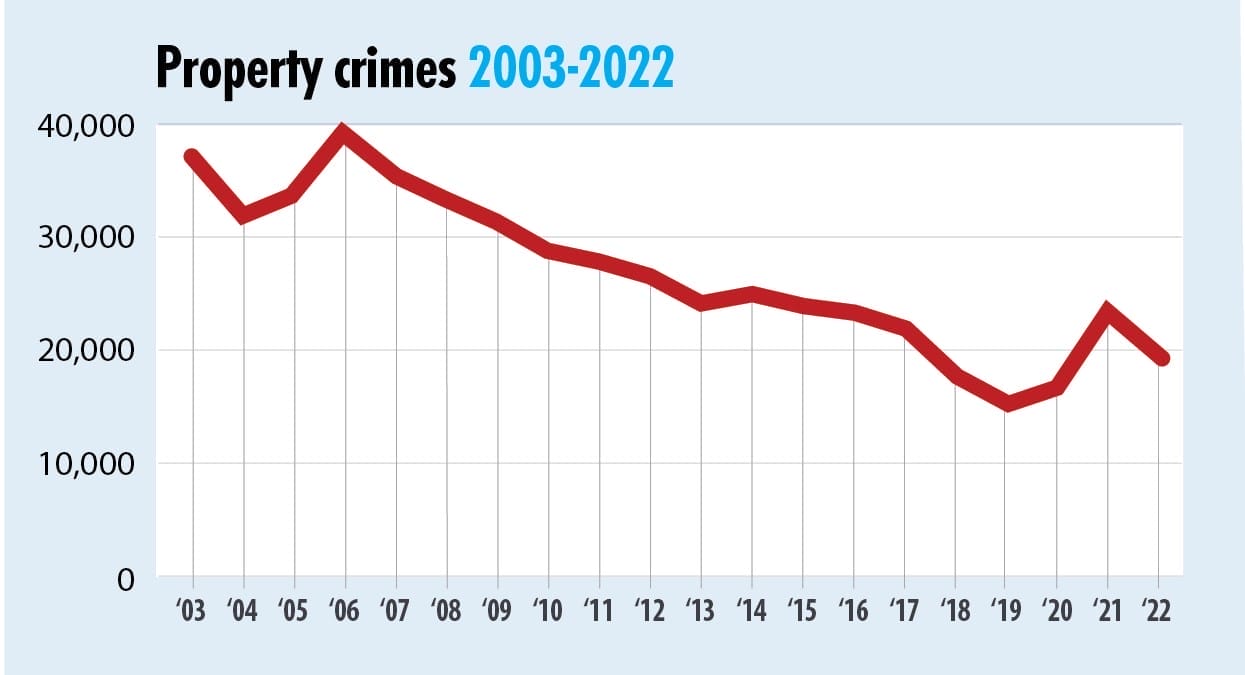
Looking at the crime trends over the decade illustrates how changes in high-volume offenses affect aggregate crime totals — deceptively swinging overall figures while obscuring meaningful trends.
Over the past decade, the two crime measures have diverged, with violent crime rising and property crime dropping.
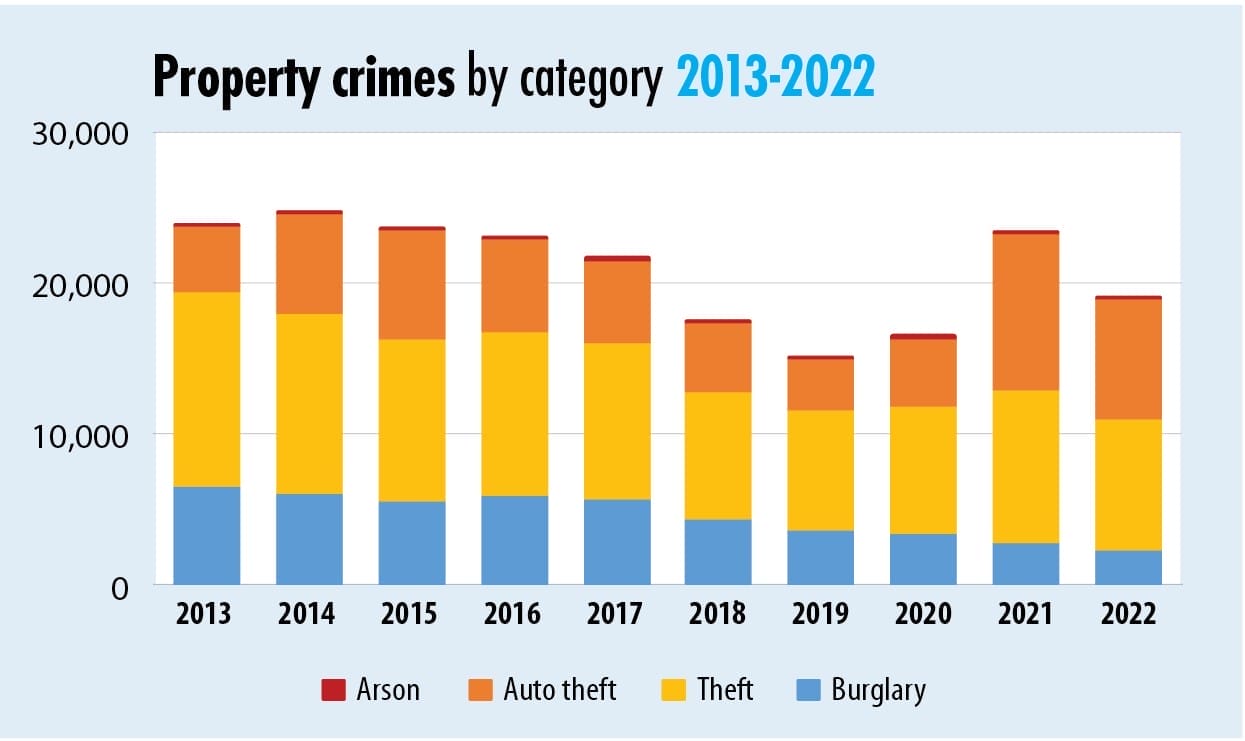
The good news is that burglaries and thefts are down substantially. A decade ago, in 2013, there were 6,620 burglaries reported in Milwaukee, but that fell to 3,692 by 2019 and further to 2,332 in 2022 — a 65% decline, or 4,288 fewer burglaries annually. Similarly, thefts fell from an annual average of about 23,000 in the five years of 2003 through 2007 to almost half that by 2013 — 12,987 — and then to 7,985 in 2019. Thefts rose in 2020 and 2021, but in 2022 dropped to 8,732 — a 33% decline from 2013.
That decline of 4,255 thefts from 2013 to 2022, combined with the 4,288 decline in burglaries, meant that there were 8,543 fewer of those two property crimes in 2022 than in 2013.
Milwaukee auto thefts and assaults
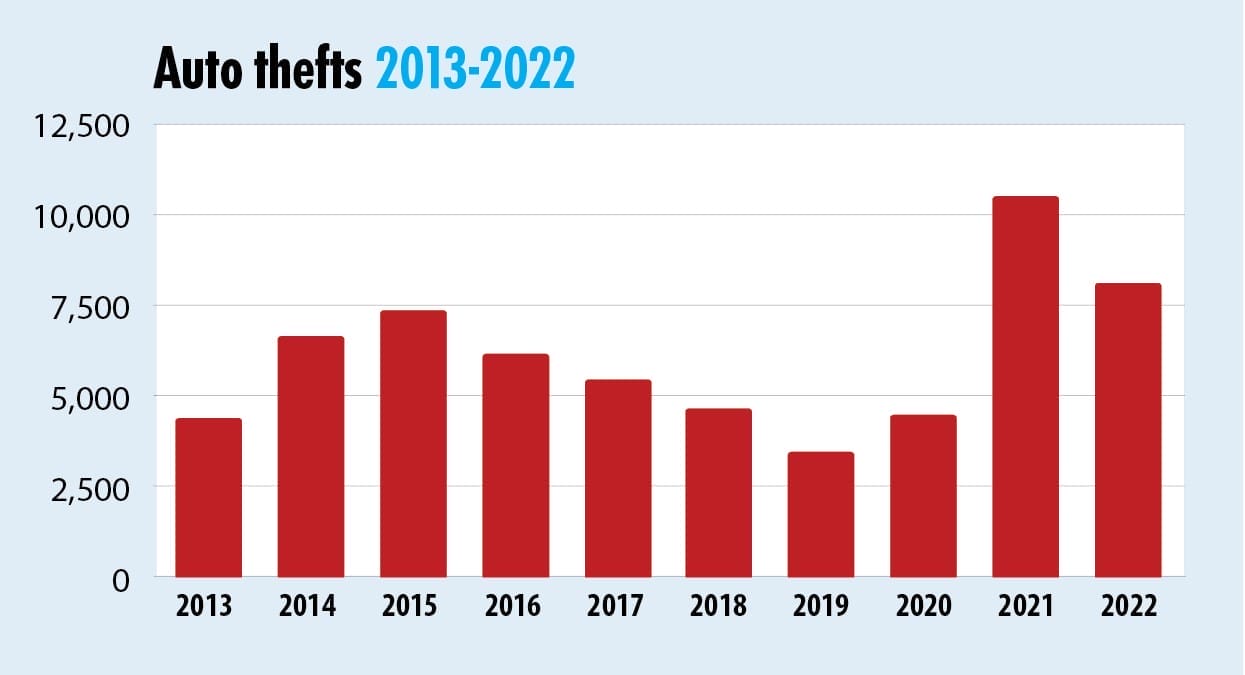
Auto theft, in the meantime, went in the other direction, jumping from 4,382 in 2013 to 10,486 in 2021 before dropping to 8,095 by 2022.
All told, overall property crime, which includes arson, burglary, theft and auto theft, fell by 20% between 2013 and 2021.
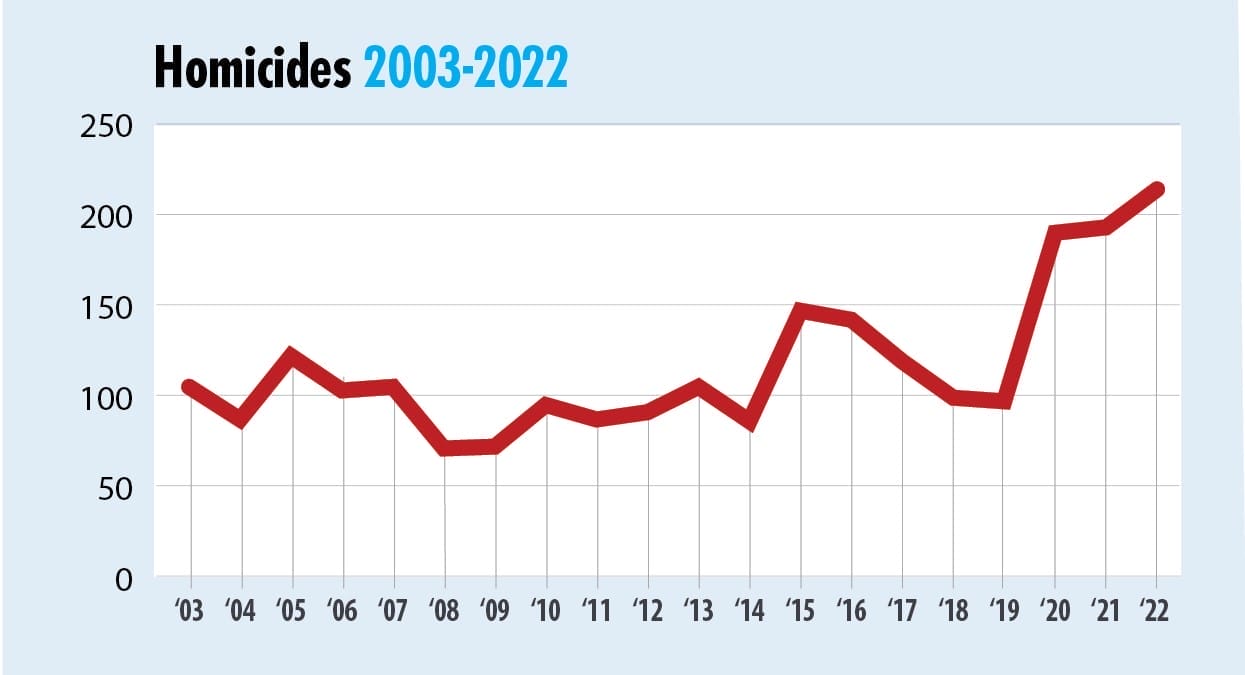
The long-term data on violent crime is much more troubling. Robberies, which consistently numbered around 3,000 a year from 2003 through 2012, declined by 46% from 2013 to 2022 — reducing the annual volume of violent crime by about 1,500 offenses. That sheer volume of decline in robberies overwhelmed the doubling of homicides in the same period, from 105 in 2013 to 214 in 2022.
Despite the decline in robberies, violent crime as a whole actually rose by nearly 16% from 2013 to 2022. That is largely due to a steep rise of 60% in aggravated assaults — an offense that by volume made up about three-fourths of violent crimes in Milwaukee in 2022. The most serious offenses, homicides and rapes, constitute only a tiny fraction, about 2%, of total serious crime even when they spiked in 2022.
Additionally, it is critical to note that these are reported offenses, not actual figures. According to the U.S. Department of Justice’s National Crime Victimization Survey (NCVS), less than one-third of property victimizations across the country were reported to police in 2021. Further, about a quarter of those are captured in police data.2
Nationwide, only 42% of burglaries and 26% of thefts were reported to police in 2021, according to the survey, down from 58% and 29%, respectively, a decade ago. If those national trends hold true for Milwaukee, the actual volume may be much larger than official statistics suggest.
Milwaukee homicides
These considerations aside, measures of serious violence are on the rise. Homicides have doubled from the two-decade average of 100 per year, reaching a record 214 killings in 2022. Non-fatal shootings have nearly doubled from 444 in 2019 to 877 in 2022. Combining the two, Milwaukee tallied at least 1,091 victims of murder or attempted murder (by gun) in 2022 compared to 541 in 2019 — 550 more victims, or a nearly 102% increase.
That longer-term perspective is lost when officials compare year-on-year data, since 2021 broke or tied Milwaukee records for aggravated assault, auto theft, rape and overall violent crime. The mayor and police chief are pointing to a mountain peak, standing on a high plateau, oblivious to the valley they came from — a self-deluding myopia or willful public deception about Milwaukee’s crime crisis.
Either way, it’s dangerous — just like Milwaukee.
Sean Kennedy is a visiting fellow at the Maryland Public Policy Institute, where his work focuses on crime and justice issues. His research and writings have appeared in The Wall Street Journal, The Washington Post, the New York Post, City Journal and The Baltimore Sun, among other publications.
This report supplements data originally presented in the Mandate for Madison, “A Tale of Two States: Wisconsin Crime Trends, 2017-2022.”
Submit a comment
"*" indicates required fields
1. The Milwaukee Police Department reports much lower auto theft numbers on its dashboard than it reported to the state in 2021. The Wisconsin Incident-Based Reporting System lists 12,304 auto thefts in 2021 while the police department only tallies 10,476 — a discrepancy of more than 1,800 car thefts. For this report, MPD figures were used throughout while the previous study used state-reported totals for Milwaukee offenses.
2. https://bjs.ojp.gov/library/publications/nations-two-crime-measures-2011-2020; https://bjs.ojp.gov/library/publications/criminal-victimization-2021
