By the numbers
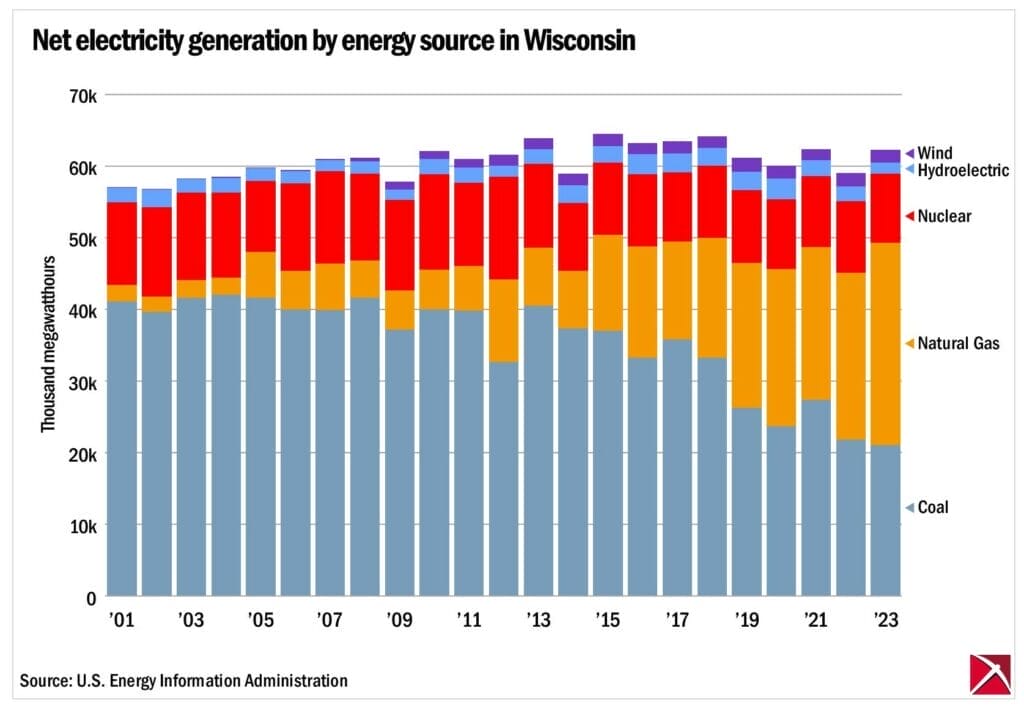
Early in his first term, Gov. Tony Evers tried committing Wisconsin to rejecting all fossil fuels as a source of electricity by 2050, an aim the Legislature rejected, but one that the governor has since pursued with executive orders. As context, Wisconsin still obtains the majority of its electricity from such conventional types of fuel. Which fossil fuels predominate, however, has changed in recent years.

Data from the federal Energy Information Administration shows that Wisconsin primarily generates its electricity from coal and natural gas. Over the past two decades, Wisconsin electric utilities have slowly been shifting from coal to natural gas. The next three biggest sources (nuclear fuels, hydroelectric dams and wind) make up a small percentage of Wisconsin’s electricity generation.
The data include net electricity generation by plants with a capacity of at least one megawatt. There are a handful of other types of electricity generation taking place in the state, but the amount generated falls below the 1 mW threshold. These other types of fuel are petroleum, solar panels, geothermal installations, and biomass.
Click here to read Badger Institutes guiding principles on energy research.
The underlying numbers
| Units are per thousand megawatt-hours | |||||
| Coal | Natural Gas | Nuclear | Hydroelectric | Wind | |
| 2023 | 21,109.37 | 28,252.56 | 9,682.77 | 1,577.29 | 1,759.11 |
| 2022 | 21,922.95 | 23,276.43 | 10,077.02 | 1,990.98 | 1,815.72 |
| 2021 | 27,441.59 | 21,342.00 | 9,970.19 | 2,144.88 | 1,593.48 |
| 2020 | 23,761.10 | 22,002.17 | 9,771.33 | 2,787.76 | 1,763.38 |
| 2019 | 26,335.39 | 20,334.49 | 10,030.31 | 2,641.01 | 1,877.81 |
| 2018 | 33,322.38 | 16,798.66 | 10,129.12 | 2,392.01 | 1,637.66 |
| 2017 | 35,852.22 | 13,655.69 | 9,648.98 | 2,657.23 | 1,640.69 |
| 2016 | 33,362.84 | 15,472.76 | 10,151.39 | 2,795.26 | 1,515.26 |
| 2015 | 37,180.55 | 13,398.78 | 10,008.18 | 2,340.68 | 1,589.38 |
| 2014 | 37,449.26 | 8,053.50 | 9,447.10 | 2,471.77 | 1,618.00 |
| 2013 | 40,645.18 | 8,102.49 | 11,675.19 | 1,978.87 | 1,557.92 |
| 2012 | 32,758.44 | 11,542.01 | 14,299.60 | 1,530.26 | 1,557.58 |
| 2011 | 39,937.74 | 6,243.34 | 11,559.78 | 2,146.91 | 1,187.73 |
| 2010 | 40,168.73 | 5,496.81 | 13,280.94 | 2,111.85 | 1,088.46 |
| 2009 | 37,279.99 | 5,484.14 | 12,683.15 | 1,393.99 | 1,051.97 |
| 2008 | 41,705.86 | 5,243.59 | 12,154.51 | 1,616.14 | 487.14 |
| 2007 | 40,028.25 | 6,488.75 | 12,910.32 | 1,516.08 | 109.28 |
| 2006 | 40,116.49 | 5,358.48 | 12,233.52 | 1,678.60 | 101.38 |
| 2005 | 41,729.31 | 6,386.79 | 9,920.99 | 1,740.22 | 92.54 |
| 2004 | 42,148.18 | 2,405.36 | 11,887.85 | 1,980.68 | 103.56 |
| 2003 | 41,717.22 | 2,478.39 | 12,215.46 | 1,843.30 | 97.58 |
| 2002 | 39,807.48 | 2,076.31 | 12,448.81 | 2,515.02 | 46.18 |
| 2001 | 41,253.46 | 2,233.97 | 11,507.08 | 2,056.24 | 72.28 |
Submit a comment
"*" indicates required fields


