By the numbers
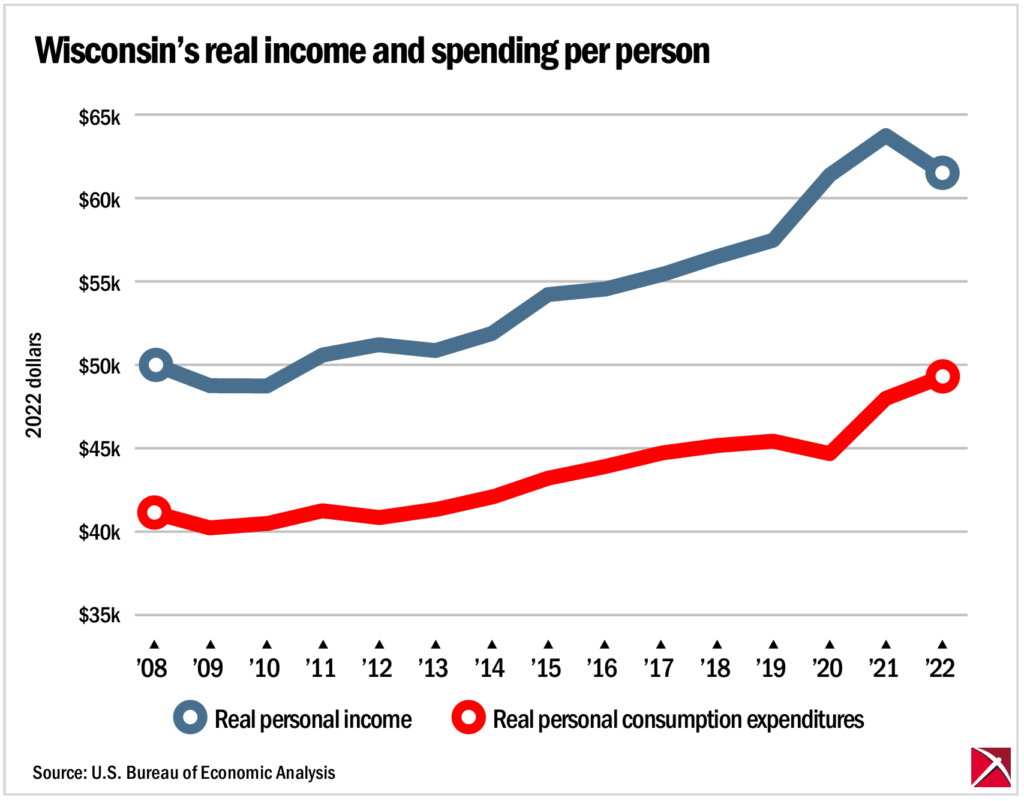
Wisconsinites’ real incomes fell in 2022 while expenses continued to rise, figures from the U.S. Bureau of Economic Analysis show.

The BEA defines personal income as “income that people get from wages and salaries, Social Security, and other governmental benefits, dividends and interest, and other sources.” The BEA does not include capital gains as personal income.
The measure of personal income for Wisconsin reports the combined personal incomes of all residents, including those who work outside the state. A separate but related metric is disposable personal income, which is income remaining after paying taxes.
To derive per capita income, the total amount of personal income for Wisconsin is divided by the state’s population.
Consumer spending is defined by the BEA as the value of the goods and services purchased by people living within the state. The BEA uses information it collects on consumption to calculate the state per capita personal consumption expenditure (PCE) by dividing expenditures by the population.
These statistics measure “real values,” which means that they account for inflation. In nominal terms, personal income did increase between 2021 and 2022, the most recent figures for which data are available. That is, people took home more in salaries, interest and dividend income, and Social Security benefits. But the value of that personal income went down because inflation caused prices to rise faster than income.
It is important to point out that these figures do not directly estimate a given household’s financial situation. Rather, this is an aggregate measure of the whole of the state expressed in per-person terms.
The underlying numbers
| Year | Real per capita personal income (2022 dollars) | Real per capita personal consumption expenditure (2022 dollars) |
| 2008 | $50,037 | $41,156 |
| 2009 | $48,773 | $40,248 |
| 2010 | $48,738 | $40,505 |
| 2011 | $50,573 | $41,278 |
| 2012 | $51,227 | $40,869 |
| 2013 | $50,851 | $41,358 |
| 2014 | $51,922 | $42,097 |
| 2015 | $54,229 | $43,217 |
| 2016 | $54,537 | $43,928 |
| 2017 | $55,403 | $44,723 |
| 2018 | $56,509 | $45,174 |
| 2019 | $57,435 | $45,428 |
| 2020 | $61,356 | $44,675 |
| 2021 | $63,735 | $47,956 |
| 2022 | $61,496 | $49,284 |
Submit a comment
"*" indicates required fields


