By the numbers
Former Gov. Lee Sherman Dreyfus once famously described Madison as “30 square miles surrounded by reality.”
There will never be a better description.
But, we wonder, how big is it in comparison to reality?
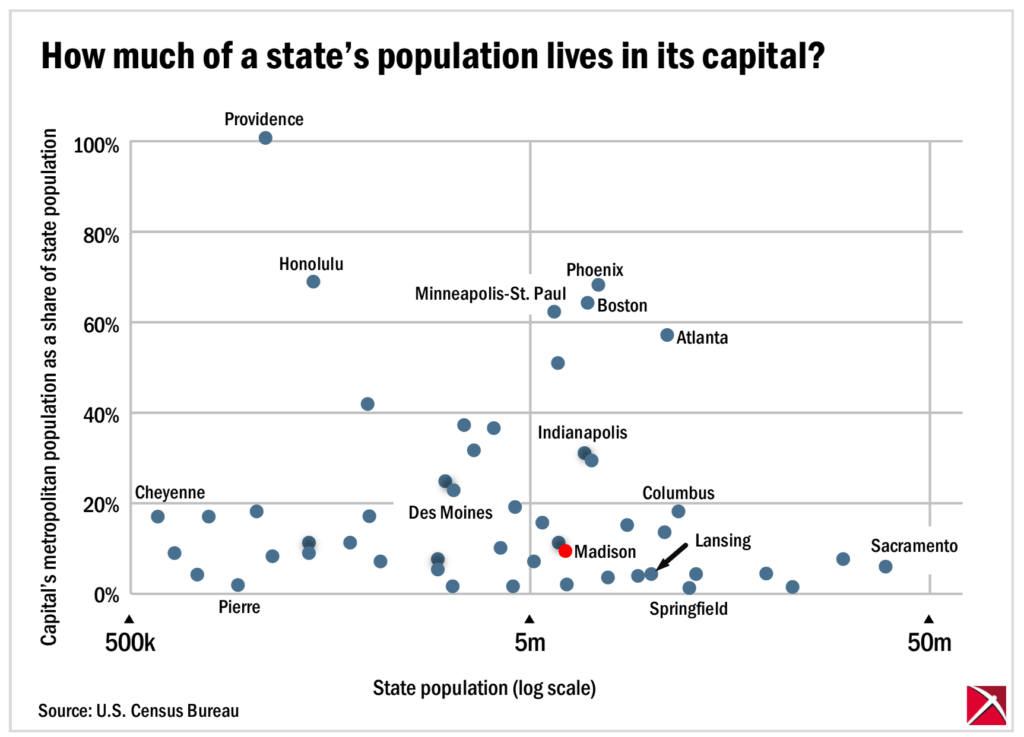
The population of the Madison metropolitan area was estimated to be about 694,000 in 2023 by the U.S. Census Bureau, meaning that metropolitan Madison contains about 11.7% of Wisconsin’s total population.
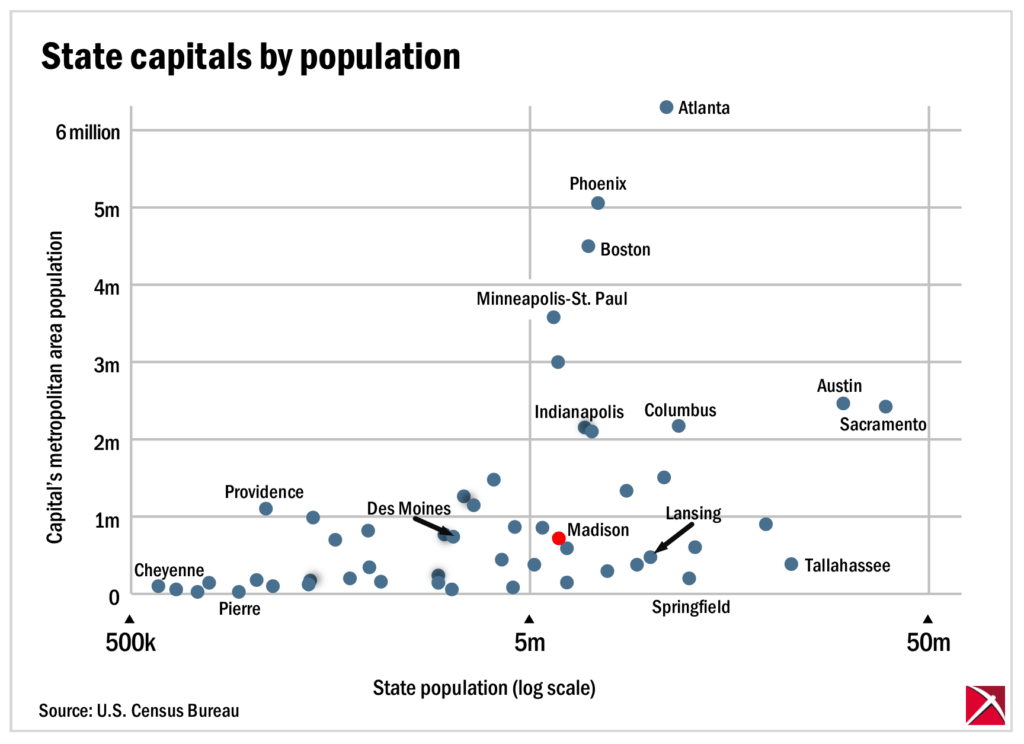
That places Madison squarely in the middle of the pack of U.S. state capitals in terms of each capital’s share of its state’s total population. The 24th biggest state capital, it ranks 25th in terms of its share of population.

For this analysis, we’re using the population of each capital’s surrounding metropolitan or micropolitan statistical area, which the Census Bureau defines as “a core area containing a substantial population nucleus, together with adjacent communities having a high degree of economic and social integration with that core.”
The Madison MSA is defined as Dane, Columbia, Green and Iowa counties.
Harrisburg, Pa., Des Moines, Iowa, and Little Rock, Ark. have metropolitan populations similar to Madison. Des Moines and Little Rock represent a larger share of their states’ total population, however, while Harrisburg is a much smaller proportion of Pennsylvania’s population.
The smallest state capital is Pierre, S.D., at just 20,667 people in its micropolitan statistical area. That represents 2.2% of South Dakota’s overall population.

On the other hand, the largest state capital is Atlanta, its metropolitan area home to over 6.3 million residents, encompassing 57% of Georgia’s total population.
The capitals which contain the smallest share of their state’s respective populations are Springfield, Ill. (1.6%), Frankfort, Ky. (1.7%), and Tallahassee, Fla. (1.7%). The capitals with the largest shares of their states’ population are Boston (63.8%), Phoenix (68.2%), and Honolulu (68.9%).
One notable outlier is Providence, where the metropolitan area includes every county (and all the population) in Rhode Island, as well as an additional county in Massachusetts.
For the purposes of this analysis, Wisconsin’s Pierce and St. Croix counties were excluded from the Minneapolis-St. Paul calculation. The population of Anne Arundel County was used for Annapolis, Md., which otherwise would be a distinct city on the edge of the broader Baltimore metropolitan area.
The underlying numbers
| Capital | Metro-/Micropolitan Statistical Area Population | State Population | Percent |
| Montgomery, Alabama | 385,480 | 5,108,468 | 7.5% |
| Juneau, Alaska | 31,555 | 733,406 | 4.3% |
| Phoenix, Arizona | 5,070,110 | 7,431,344 | 68.2% |
| Little Rock, Arkansas | 764,045 | 3,067,732 | 24.9% |
| Sacramento, California | 2,420,608 | 38,965,193 | 6.2% |
| Denver, Colorado | 3,005,131 | 5,877,610 | 51.1% |
| Hartford, Connecticut | 1,151,543 | 3,617,176 | 31.8% |
| Dover, Delaware | 189,789 | 1,031,890 | 18.4% |
| Tallahassee, Florida | 392,645 | 22,610,726 | 1.7% |
| Atlanta, Georgia | 6,307,261 | 11,029,227 | 57.2% |
| Honolulu, Hawaii | 989,408 | 1,435,138 | 68.9% |
| Boise, Idaho | 824,657 | 1,964,726 | 42.0% |
| Springfield, Illinois | 205,445 | 12,549,689 | 1.6% |
| Indianapolis, Indiana | 2,138,468 | 6,862,199 | 31.2% |
| Des Moines, Iowa | 737,164 | 3,207,004 | 23.0% |
| Topeka, Kansas | 232,322 | 2,940,546 | 7.9% |
| Frankfort, Kentucky | 76,257 | 4,526,154 | 1.7% |
| Baton Rouge, Louisiana | 873,661 | 4,573,749 | 19.1% |
| Augusta, Maine | 127,259 | 1,395,722 | 9.1% |
| Annapolis, Maryland | 594582 | 6,180,253 | 9.6% |
| Boston, Massachusetts | 4,465,247 | 7,001,399 | 63.8% |
| Lansing, Michigan | 473,177 | 10,037,261 | 4.7% |
| Saint Paul, Minnesota | 3,572,231 | 5,737,915 | 62.3% |
| Jackson, Mississippi | 159,424 | 2,939,690 | 5.4% |
| Jefferson City, Missouri | 150,733 | 6,196,156 | 2.4% |
| Helena, Montana | 96,091 | 1,132,812 | 8.5% |
| Lincoln, Nebraska | 344,387 | 1,978,379 | 17.4% |
| Carson City, Nevada | 58,036 | 3,194,176 | 1.8% |
| Concord, New Hampshire | 157,103 | 1,402,054 | 11.2% |
| Trenton, New Jersey | 381,671 | 9,290,841 | 4.1% |
| Santa Fe, New Mexico | 155,956 | 2,114,371 | 7.4% |
| Albany, New York | 904,682 | 19,571,216 | 4.6% |
| Raleigh, North Carolina | 1,509,231 | 10,835,491 | 13.9% |
| Bismarck, North Dakota | 135,786 | 783,926 | 17.3% |
| Columbus, Ohio | 2,180,271 | 11,785,935 | 18.5% |
| Oklahoma City | 1,477,926 | 4,053,824 | 36.5% |
| Salem, Oregon | 436,546 | 4,233,358 | 10.3% |
| Harrisburg, Pennsylvania | 606,055 | 12,961,683 | 4.7% |
| Providence, Rhode Island | 1,095,962 | 1,095,962 | 100.0% |
| Columbia, South Carolina | 858,302 | 5,373,555 | 16.0% |
| Pierre, South Dakota | 20,667 | 919,318 | 2.2% |
| Nashville, Tennessee | 2,102,573 | 7,126,489 | 29.5% |
| Austin, Texas | 2,473,275 | 30,503,301 | 8.1% |
| Salt Lake City, Utah | 1,267,864 | 3,417,734 | 37.1% |
| Montpelier, Vermont | 60,142 | 647,464 | 9.3% |
| Richmond, Virginia | 1,349,732 | 8,715,698 | 15.5% |
| Olympia, Washington | 299,003 | 7,812,880 | 3.8% |
| Charleston, West Virginia | 203,164 | 1,770,071 | 11.5% |
| Madison, Wisconsin | 694,345 | 5,910,955 | 11.7% |
| Cheyenne, Wyoming | 100,984 | 584,057 | 17.3% |
Submit a comment
"*" indicates required fields


