By the numbers
Wisconsin just celebrated a record breaking attendance at the Wisconsin State Fair, its largest statewide event, earlier this month. The festival in West Allis attracted 1,136,805 visitors over its 11-day run, topping the previous record of 1,130,572 set in 2019.
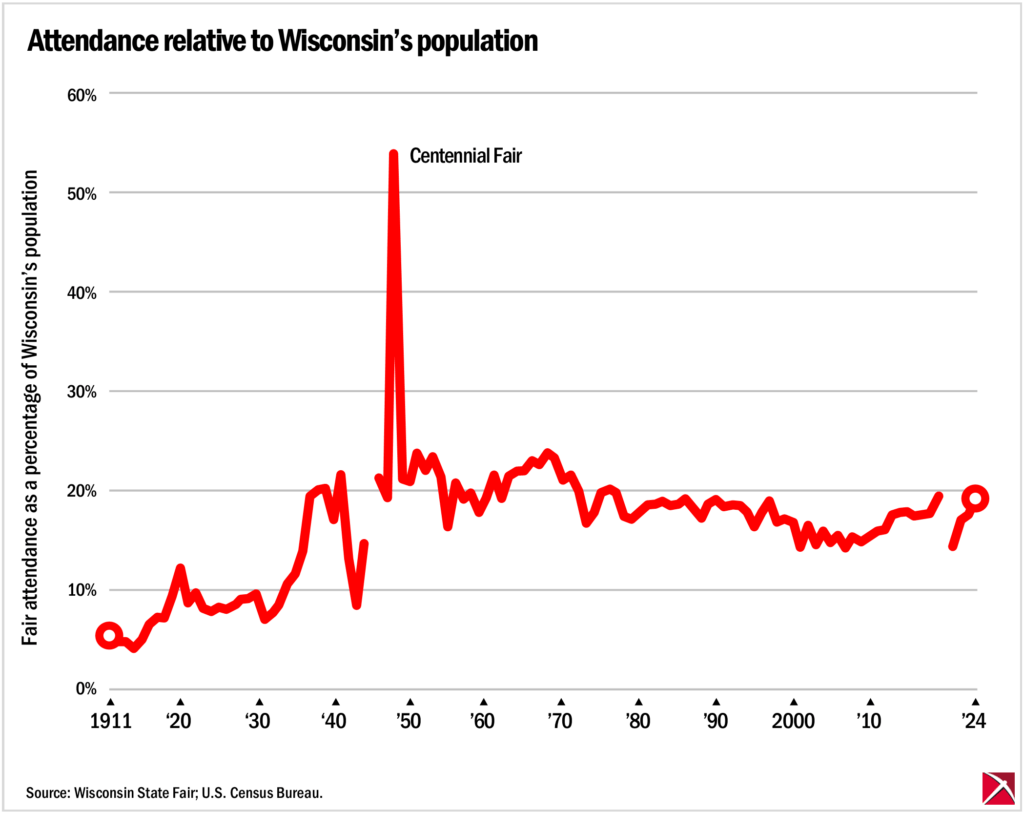
Since in the fair’s 2020 cancelation due to COVID-19 lockdowns, attendance has slowly caught up to pre-pandemic levels. But the fair’s attendance relative to Wisconsin’s population has not quite reached its pre-COVID peak.

This year’s attendance was equal to 19.17% of the state’s estimated 5.93 million people. That’s up from 17.6% in 2023, but still slightly less than the 19.41% in 2019.
The most-attended fair in Wisconsin history occurred in 1948. In celebration of the centennial of Wisconsin statehood, the length of the State Fair was doubled to 23 days and drew a whopping 1,786,818 visitors, a number equal to more than half the state’s population at the time of 3.31 million.
The 1968 State Fair marked the first time the milestone of one million visitors was crossed during an ordinary year, with 1,032,740 people attending that year. After declining to 1.02 million in 1969, State Fair attendance wouldn’t cross the million-visitor threshold again until 2013.
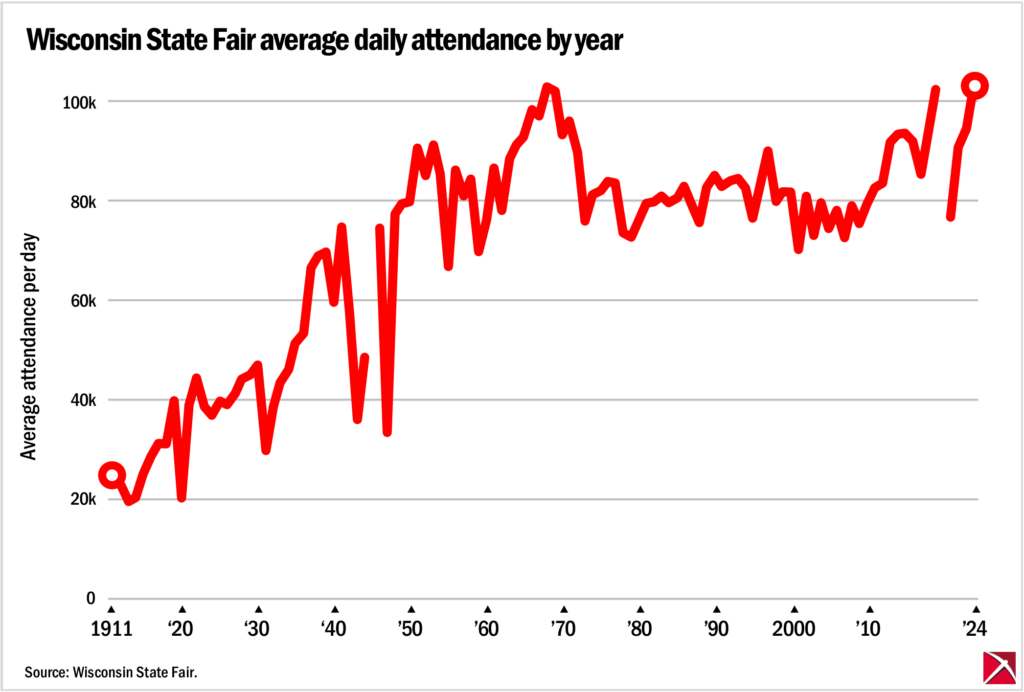
The 1968 fair also set an average daily attendance record that would hold until 2024, which broke the record with an average of 103,346 visitors per day.

The fair has been canceled only a handful of times since it was first held in 1851. It was canceled three years in a row from 1861 to 1863 due to the Civil War. The fair was skipped in 1893 because of the Chicago World’s Fair. The fair was canceled once again in 1945 due to World War II, and finally in 2020 because of pandemic lockdowns.
In terms of overall attendance, average daily attendance, and attendance relative to population, the Wisconsin State Fair is trending in a positive direction, and that is a good thing for the surrounding communities: In a recent report, the State Fair Board stated that the event generates an economic impact of more than $200 million annually for the state.
*Official intercensal estimates for 2024 by the U.S. Census Bureau were not available at deadline.
The underlying numbers
| Year | Dates | Attendance | State population | Attendance expressed as a percentage of state population |
| 1911 | September 12-16 | 125,755 | 2,369,000 | 5.31% |
| 1912 | September 10-14 | 115,803 | 2,407,000 | 4.81% |
| 1913 | September 8-13 | 118,288 | 2,438,000 | 4.85% |
| 1914 | September 14-18 | 104,000 | 2,490,000 | 4.18% |
| 1915 | September 13-17 | 127,271 | 2,535,000 | 5.02% |
| 1916 | September 11-16 | 172,620 | 2,562,000 | 6.74% |
| 1917 | September 10-15 | 188,889 | 2,587,000 | 7.30% |
| 1918 | September 9-14 | 188,592 | 2,597,000 | 7.26% |
| 1919 | September 8-13 | 242,095 | 2,600,000 | 9.31% |
| 1920 | August 20-September 4 | 327,394 | 2,679,000 | 12.22% |
| 1921 | August 29-September 3 | 237,014 | 2,722,000 | 8.71% |
| 1922 | August 28-September 2 | 267,984 | 2,761,000 | 9.71% |
| 1923 | August 27-September 1 | 233,655 | 2,803,000 | 8.34% |
| 1924 | August 25-30 | 223,084 | 2,833,000 | 7.87% |
| 1925 | August 31-September 5 | 239,803 | 2,863,000 | 8.38% |
| 1926 | August 30-September 4 | 235,627 | 2,892,000 | 8.15% |
| 1927 | August 29-September 3 | 248,816 | 2,916,000 | 8.53% |
| 1928 | August 27-September 1 | 267,471 | 2,923,000 | 9.15% |
| 1929 | August 26-31 | 272,411 | 2,934,000 | 9.28% |
| 1930 | August 25-30 | 283,426 | 2,950,000 | 9.61% |
| 1931 | August 29-September 4 | 210,317 | 2,990,000 | 7.03% |
| 1932 | August 28-September 2 | 232,417 | 3,021,000 | 7.69% |
| 1933 | August 27-September 1 | 263,698 | 3,040,000 | 8.67% |
| 1934 | August 25-31 | 325,405 | 3,054,000 | 10.66% |
| 1935 | August 24-30 | 361,418 | 3,070,000 | 11.77% |
| 1936 | August 22-29 | 429,445 | 3,082,000 | 13.93% |
| 1937 | August 21-29 | 602,436 | 3,088,000 | 19.51% |
| 1938 | August 20-28 | 624,411 | 3,098,000 | 20.16% |
| 1939 | August 19-27 | 630,954 | 3,121,000 | 20.22% |
| 1940 | August 17-25 | 537,291 | 3,143,000 | 17.09% |
| 1941 | August 16-24 | 676,288 | 3,140,000 | 21.54% |
| 1942 | August 22-28 | 407,589 | 3,053,000 | 13.35% |
| 1943 | August 21-27 | 255,491 | 3,014,000 | 8.48% |
| 1944 | August 19-27 | 438,929 | 2,980,000 | 14.73% |
| 1945 | Canceled | 0 | 2,961,000 | 0.00% |
| 1946 | August 17-25 | 674,683 | 3,167,000 | 21.30% |
| 1947 | August 6-24 | 633,580 | 3,250,000 | 19.49% |
| 1948 | August 7-29 | 1,786,818 | 3,314,000 | 53.92% |
| 1949 | August 20-28 | 717,900 | 3,391,000 | 21.17% |
| 1950 | August 19-27 | 721,781 | 3,438,000 | 20.99% |
| 1951 | August 18-26 | 819,210 | 3,439,000 | 23.82% |
| 1952 | August 16-24 | 767,757 | 3,469,000 | 22.13% |
| 1953 | August 22-30 | 824,211 | 3,506,000 | 23.51% |
| 1954 | August 21-29 | 770,664 | 3,608,000 | 21.36% |
| 1955 | August 19-27 | 604,694 | 3,679,000 | 16.44% |
| 1956 | August 18-26 | 779,546 | 3,742,000 | 20.83% |
| 1957 | August 17-25 | 728,891 | 3,791,000 | 19.23% |
| 1958 | August 16-24 | 763,644 | 3,843,000 | 19.87% |
| 1959 | August 21-30 | 700,264 | 3,891,000 | 18.00% |
| 1960 | August 19-28 | 761,293 | 3,962,000 | 19.21% |
| 1961 | August 11-20 | 868,756 | 4,009,000 | 21.67% |
| 1962 | August 10-19 | 783,258 | 4,049,000 | 19.34% |
| 1963 | August 9-18 | 886,694 | 4,112,000 | 21.56% |
| 1964 | August 14-23 | 917,199 | 4,165,000 | 22.02% |
| 1965 | August 13-22 | 933,044 | 4,232,000 | 22.05% |
| 1966 | August 12-21 | 985,296 | 4,274,000 | 23.05% |
| 1967 | August 11-20 | 974,757 | 4,303,000 | 22.65% |
| 1968 | August 9-18 | 1,032,740 | 4,345,000 | 23.77% |
| 1969 | August 8-17 | 1,022,793 | 4,378,000 | 23.36% |
| 1970 | August 14-23 | 934,564 | 4,417,821 | 21.15% |
| 1971 | August 13-22 | 963,653 | 4,462,155 | 21.60% |
| 1972 | August 11-20 | 900,082 | 4,502,412 | 19.99% |
| 1973 | August 10-19 | 761,925 | 4,524,244 | 16.84% |
| 1974 | August 9-18 | 813,433 | 4,545,782 | 17.89% |
| 1975 | August 7-17 | 907,176 | 4,578,986 | 19.81% |
| 1976 | August 12-22 | 926,611 | 4,595,904 | 20.16% |
| 1977 | August 11-21 | 920,686 | 4,626,514 | 19.90% |
| 1978 | August 10-20 | 815,528 | 4,646,108 | 17.55% |
| 1979 | August 2-12 | 801,905 | 4,682,811 | 17.12% |
| 1980 | July 31-August 10 | 840,716 | 4,712,045 | 17.84% |
| 1981 | August 6-16 | 878,271 | 4,726,343 | 18.58% |
| 1982 | August 5-15 | 881,350 | 4,728,870 | 18.64% |
| 1983 | August 4-14 | 893,947 | 4,721,438 | 18.93% |
| 1984 | August 2-12 | 879,640 | 4,735,563 | 18.58% |
| 1985 | August 1-11 | 889,271 | 4,747,767 | 18.73% |
| 1986 | July 31-August 10 | 915,642 | 4,755,618 | 19.25% |
| 1987 | August 6-16 | 872,191 | 4,777,919 | 18.25% |
| 1988 | August 4-14 | 834,782 | 4,822,388 | 17.31% |
| 1989 | August 3-13 | 912,846 | 4,856,574 | 18.80% |
| 1990 | August 2-12 | 938,658 | 4,902,265 | 19.15% |
| 1991 | August 1-11 | 915,217 | 4,952,675 | 18.48% |
| 1992 | August 6-16 | 928,040 | 5,004,636 | 18.54% |
| 1993 | August 5-15 | 932,811 | 5,055,318 | 18.45% |
| 1994 | August 4-14 | 910,662 | 5,095,504 | 17.87% |
| 1995 | August 3-13 | 843,778 | 5,137,004 | 16.43% |
| 1996 | August 1-11 | 922,267 | 5,173,828 | 17.83% |
| 1997 | July 31-August 10 | 991,384 | 5,200,235 | 19.06% |
| 1998 | August 6-16 | 881,313 | 5,222,124 | 16.88% |
| 1999 | August 5-15 | 903,846 | 5,250,446 | 17.21% |
| 2000 | August 3-13 | 904,059 | 5,373,849 | 16.82% |
| 2001 | August 2-12 | 774,650 | 5,405,429 | 14.33% |
| 2002 | August 1-11 | 894,709 | 5,442,086 | 16.44% |
| 2003 | July 31-August 10 | 806,484 | 5,473,577 | 14.73% |
| 2004 | August 5-15 | 879,322 | 5,505,775 | 15.97% |
| 2005 | August 4-14 | 822,518 | 5,534,777 | 14.86% |
| 2006 | August 3-13 | 861,408 | 5,561,833 | 15.49% |
| 2007 | August 2-12 | 801,420 | 5,591,292 | 14.33% |
| 2008 | July 31-August 10 | 872,458 | 5,616,954 | 15.53% |
| 2009 | August 6-16 | 833,285 | 5,640,380 | 14.77% |
| 2010 | August 5-15 | 876,020 | 5,690,538 | 15.39% |
| 2011 | August 4-14 | 911,231 | 5,705,840 | 15.97% |
| 2012 | August 2-12 | 920,962 | 5,720,825 | 16.10% |
| 2013 | August 1-11 | 1,012,552 | 5,738,012 | 17.65% |
| 2014 | July 31-August 10 | 1,030,881 | 5,753,199 | 17.92% |
| 2015 | August 6-16 | 1,033,053 | 5,762,927 | 17.93% |
| 2016 | August 4-14 | 1,015,815 | 5,775,170 | 17.59% |
| 2017 | August 2-13 | 1,028,049 | 5,793,147 | 17.75% |
| 2018 | August 2-12 | 1,037,982 | 5,809,319 | 17.87% |
| 2019 | August 1-11 | 1,130,572 | 5,824,581 | 19.41% |
| 2020 | Canceled | 0 | 5,896,700 | 0.00% |
| 2021 | August 5-15 | 841,074 | 5,879,978 | 14.30% |
| 2022 | August 4-14 | 1,003,450 | 5,890,543 | 17.03% |
| 2023 | August 3-13 | 1,043,350 | 5,910,955 | 17.65% |
| 2024 | August 1-11 | 1,136,805 | 5,931,367 | 19.17% |
Submit a comment
"*" indicates required fields


