By the numbers
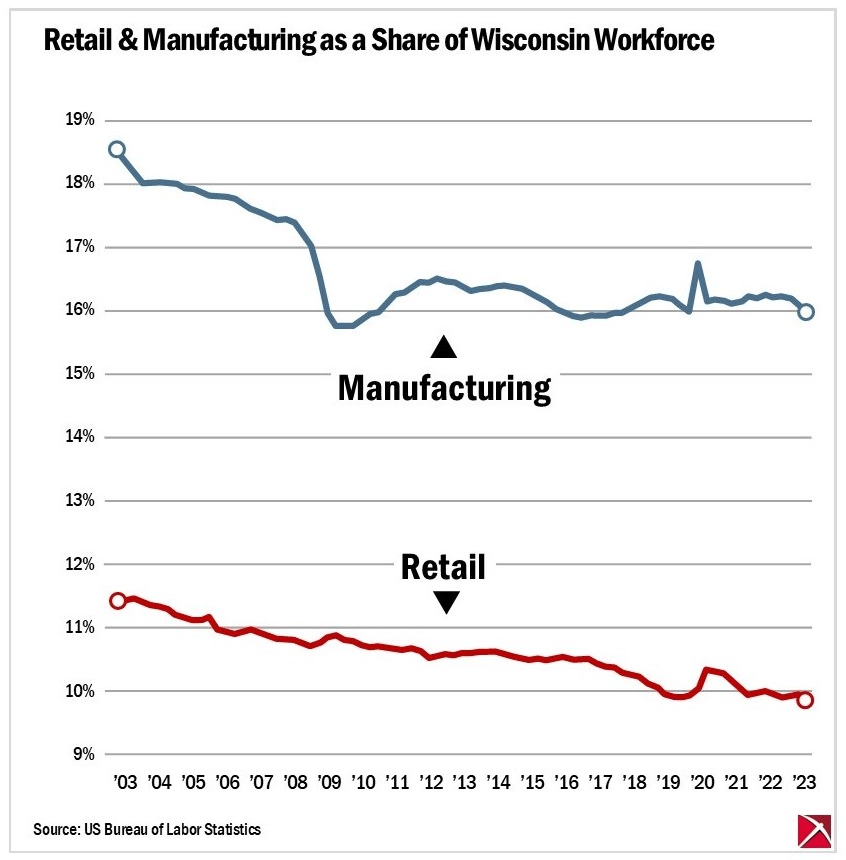
The percentage of Wisconsin workers who are employed in the manufacturing and retail sectors has been on a steady decline over the past two decades.
This is a topic the Badger Institute has addressed in past work.
The Institute investigated the shrinking of Milwaukee’s manufacturing sector in 2013: Ryan Berg examined labor force issues as part of a larger paper on Milwaukee’s economic future.
In 2019, Richard Esenberg examined the changes in retail in the context of market dynamism.
The underlying numbers

The figures are from the U.S. Bureau of Labor Statistics and are calculated as seasonally adjusted annual average levels of employed people in each sector as a percentage of Wisconsin’s seasonally adjusted total nonfarm employment. Quarters are of calendar years.
The underlying numbers, expressed in thousands of employees:
| Employed in retail (000) | Employed in manufacturing (000) | |
| Q1 2003 | 316.8 | 514.0 |
| Q2 2003 | 317.3 | 507.9 |
| Q3 2003 | 316.9 | 502.0 |
| Q4 2003 | 317.2 | 500.3 |
| Q1 2004 | 316.6 | 501.5 |
| Q2 2004 | 317.3 | 503.9 |
| Q3 2004 | 317.5 | 506.5 |
| Q4 2004 | 315.6 | 507.3 |
| Q1 2005 | 315.0 | 506.3 |
| Q2 2005 | 315.2 | 507.4 |
| Q3 2005 | 316.1 | 507.2 |
| Q4 2005 | 318.6 | 507.0 |
| Q1 2006 | 313.1 | 508.1 |
| Q2 2006 | 313.1 | 509.1 |
| Q3 2006 | 312.3 | 508.5 |
| Q4 2006 | 313.7 | 506.5 |
| Q1 2007 | 315.4 | 505.0 |
| Q2 2007 | 314.7 | 505.4 |
| Q3 2007 | 313.3 | 503.5 |
| Q4 2007 | 311.6 | 501.1 |
| Q1 2008 | 311.9 | 502.4 |
| Q2 2008 | 310.9 | 500.3 |
| Q3 2008 | 309.2 | 493.9 |
| Q4 2008 | 305.2 | 485.0 |
| Q1 2009 | 300.7 | 461.9 |
| Q2 2009 | 297.9 | 437.9 |
| Q3 2009 | 295.9 | 428.3 |
| Q4 2009 | 293.6 | 427.5 |
| Q1 2010 | 292.8 | 427.7 |
| Q2 2010 | 292.6 | 431.8 |
| Q3 2010 | 292.2 | 435.3 |
| Q4 2010 | 293.3 | 437.3 |
| Q1 2011 | 293.6 | 442.0 |
| Q2 2011 | 293.6 | 447.0 |
| Q3 2011 | 294.4 | 449.7 |
| Q4 2011 | 294.9 | 451.3 |
| Q1 2012 | 294.7 | 455.4 |
| Q2 2012 | 293.5 | 458.1 |
| Q3 2012 | 293.7 | 459.6 |
| Q4 2012 | 296.3 | 460.2 |
| Employed in retail (000) | Employed in manufacturing (000) | |
| Q1 2013 | 295.9 | 460.2 |
| Q2 2013 | 297.4 | 459.2 |
| Q3 2013 | 298.8 | 459.4 |
| Q4 2013 | 300.3 | 461.8 |
| Q1 2014 | 301.4 | 463.4 |
| Q2 2014 | 302.7 | 466.4 |
| Q3 2014 | 302.9 | 469.2 |
| Q4 2014 | 303.3 | 470.4 |
| Q1 2015 | 302.9 | 470.8 |
| Q2 2015 | 303.4 | 469.9 |
| Q3 2015 | 305.2 | 470.0 |
| Q4 2015 | 305.8 | 469.4 |
| Q1 2016 | 307.3 | 468.3 |
| Q2 2016 | 308.6 | 467.8 |
| Q3 2016 | 308.9 | 467.3 |
| Q4 2016 | 308.3 | 467.5 |
| Q1 2017 | 309.5 | 468.5 |
| Q2 2017 | 308.6 | 470.2 |
| Q3 2017 | 307.5 | 470.6 |
| Q4 2017 | 307.6 | 472.7 |
| Q1 2018 | 306.9 | 475.7 |
| Q2 2018 | 305.9 | 478.1 |
| Q3 2018 | 305.4 | 480.9 |
| Q4 2018 | 302.8 | 483.5 |
| Q1 2019 | 300.9 | 484.8 |
| Q2 2019 | 298.4 | 484.7 |
| Q3 2019 | 296.3 | 483.4 |
| Q4 2019 | 296.7 | 480.6 |
| Q1 2020 | 297.1 | 478.0 |
| Q2 2020 | 267.1 | 445.4 |
| Q3 2020 | 290.6 | 453.2 |
| Q4 2020 | 293.7 | 459.8 |
| Q1 2021 | 294.5 | 462.5 |
| Q2 2021 | 293.4 | 464.6 |
| Q3 2021 | 292.1 | 468.6 |
| Q4 2021 | 290.5 | 474.1 |
| Q1 2022 | 294.3 | 477.2 |
| Q2 2022 | 296.1 | 480.3 |
| Q3 2022 | 296.5 | 483.0 |
| Q4 2022 | 295.9 | 484.3 |
| Q1 2023 | 297.9 | 485.3 |
| Q2 2023 | 298.9 | 483.0 |
| Q3 2023 | 296.6 | 480.5 |
Published in the Nov. 24 issue of Top Picks.


