By the numbers
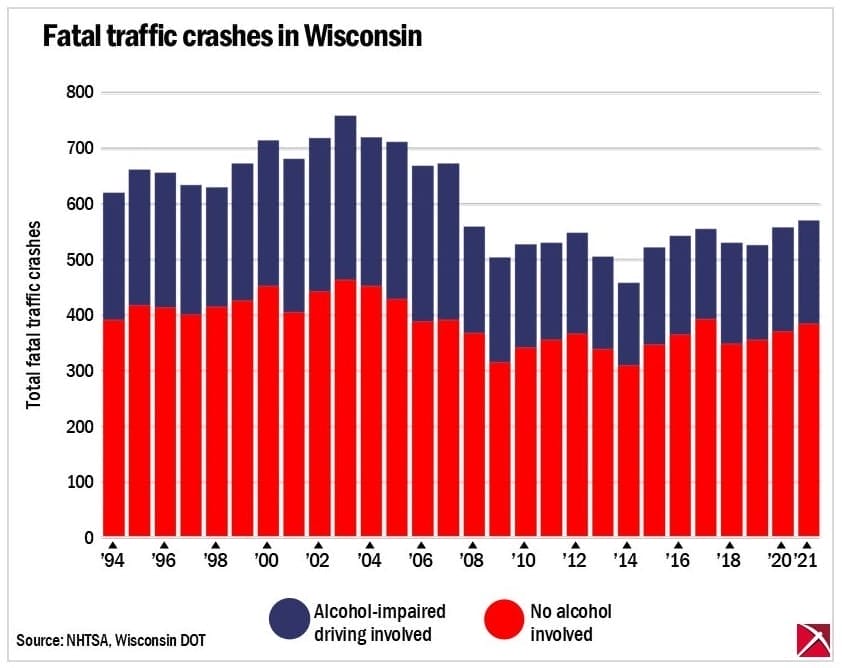
If you went out on the town to ring in the new year, perhaps you had a designated driver or called a ride and contributed to an encouraging trend: In Wisconsin, over the past few decades, the number of fatal car crashes due to alcohol-induced driving has decreased.
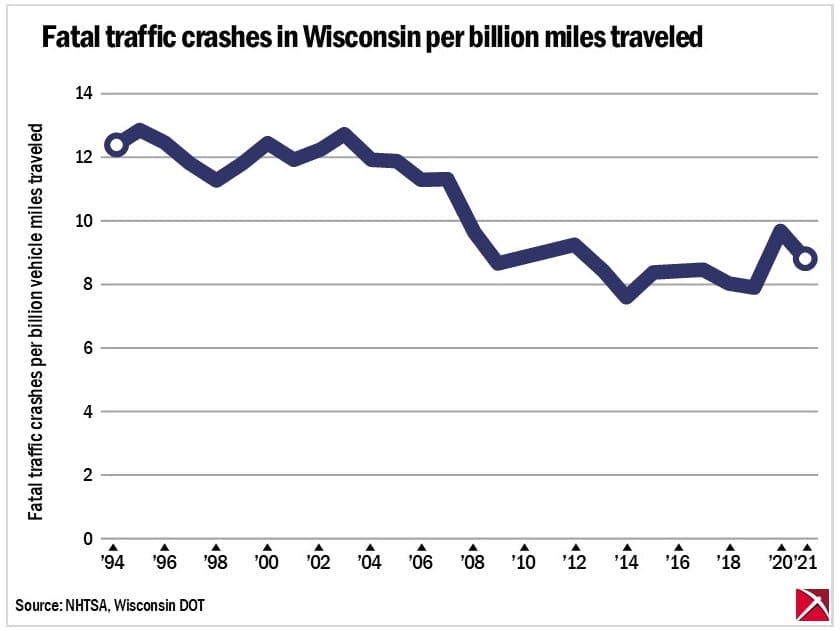
One of the possible reasons that the Badger Institute has examined is the creation of various ride share apps, such as Uber or Lyft. Whatever the cause, the fact is that the number of fatal traffic crashes in Wisconsin has fallen both in number and rate.


Crash data are from the National Highway Traffic Safety Administration. The rate of crashes, here as fatal crashes per billion vehicle miles traveled in Wisconsin, was calculated using travel data from the Wisconsin Department of Transportation.
The underlying numbers
| Year | Fatal traffic crashes | No alcohol involved | Alcohol-impaired driving involved | Vehicle miles traveled (VMT) | Number of fatal traffic crashes per billion VMT |
| 2021 | 572 | 386 | 186 | 65,003,000,000 | 8.8 |
| 2020 | 559 | 371 | 188 | 57,414,000,000 | 9.7 |
| 2019 | 527 | 356 | 171 | 66,341,000,000 | 7.9 |
| 2018 | 531 | 349 | 182 | 65,884,000,000 | 8.1 |
| 2017 | 557 | 394 | 163 | 65,324,000,000 | 8.5 |
| 2016 | 544 | 366 | 178 | 63,870,000,000 | 8.5 |
| 2015 | 523 | 348 | 175 | 62,140,000,000 | 8.4 |
| 2014 | 459 | 310 | 149 | 60,044,000,000 | 7.6 |
| 2013 | 507 | 339 | 168 | 59,484,000,000 | 8.5 |
| 2012 | 549 | 368 | 181 | 59,087,000,000 | 9.3 |
| 2011 | 532 | 356 | 176 | 58,554,000,000 | 9.1 |
| 2010 | 528 | 342 | 186 | 59,420,000,000 | 8.9 |
| 2009 | 505 | 316 | 189 | 58,157,000,000 | 8.7 |
| 2008 | 561 | 369 | 192 | 57,462,000,000 | 9.8 |
| 2007 | 675 | 392 | 283 | 59,493,000,000 | 11.3 |
| 2006 | 670 | 389 | 281 | 59,401,000,000 | 11.3 |
| 2005 | 714 | 430 | 284 | 60,018,000,000 | 11.9 |
| 2004 | 722 | 454 | 268 | 60,398,000,000 | 12.0 |
| 2003 | 761 | 464 | 297 | 59,617,000,000 | 12.8 |
| 2002 | 721 | 444 | 277 | 58,745,000,000 | 12.3 |
| 2001 | 683 | 406 | 277 | 57,266,000,000 | 11.9 |
| 2000 | 716 | 453 | 263 | 57,266,000,000 | 12.5 |
| 1999 | 675 | 427 | 248 | 56,960,000,000 | 11.9 |
| 1998 | 632 | 416 | 216 | 56,048,000,000 | 11.3 |
| 1997 | 635 | 402 | 233 | 53,729,000,000 | 11.8 |
| 1996 | 658 | 414 | 244 | 52,639,000,000 | 12.5 |
| 1995 | 663 | 419 | 244 | 51,395,000,000 | 12.9 |
| 1994 | 622 | 392 | 230 | 50,273,000,000 | 12.4 |
Published in the Jan. 5 issue of Top Picks.


