By the numbers
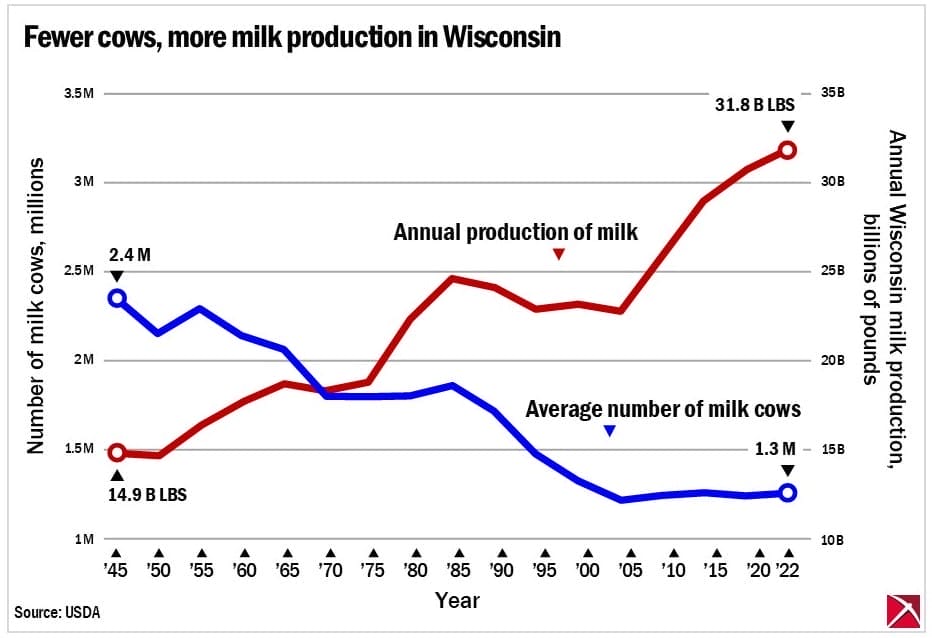
Since the end of World War II, the average number of milk cows living in Wisconsin each year has halved in size, yet the annual production of milk in the state has doubled.
While the factors underlying such a rise in dairy productivity are beyond the scope of this post, the Badger Institute, under its previous name, has in the past analyzed the impact of government on Wisconsin agriculture.
The underlying data

The lines are on two separate scales: The blue line and the left scale depict the average number of milk cows each year by five-year increments. This scale is in millions. The red line and the right scale depict annual milk production. This scale is in billions.
The underlying numbers
| Year | Cows (annual average, thousands) | Production (annual, millions of pounds) |
| 1945 | 2,360 | 14,939 |
| 1950 | 2,160 | 14,796 |
| 1955 | 2,302 | 16,482 |
| 1960 | 2,150 | 17,780 |
| 1965 | 2,075 | 18,841 |
| 1970 | 1,814 | 18,435 |
| 1975 | 1,812 | 18,900 |
| 1980 | 1,815 | 22,380 |
| 1985 | 1,876 | 24,700 |
| 1990 | 1,731 | 24,187 |
| 1995 | 1,490 | 22,942 |
| 2000 | 1,344 | 23,259 |
| 2005 | 1,236 | 22,866 |
| 2010 | 1,262 | 26,035 |
| 2015 | 1,279 | 29,030 |
| 2020 | 1,259 | 30,749 |
| 2022 | 1,272 | 31,882 |
Published in the Dec. 8 issue of Top Picks.


