By the numbers
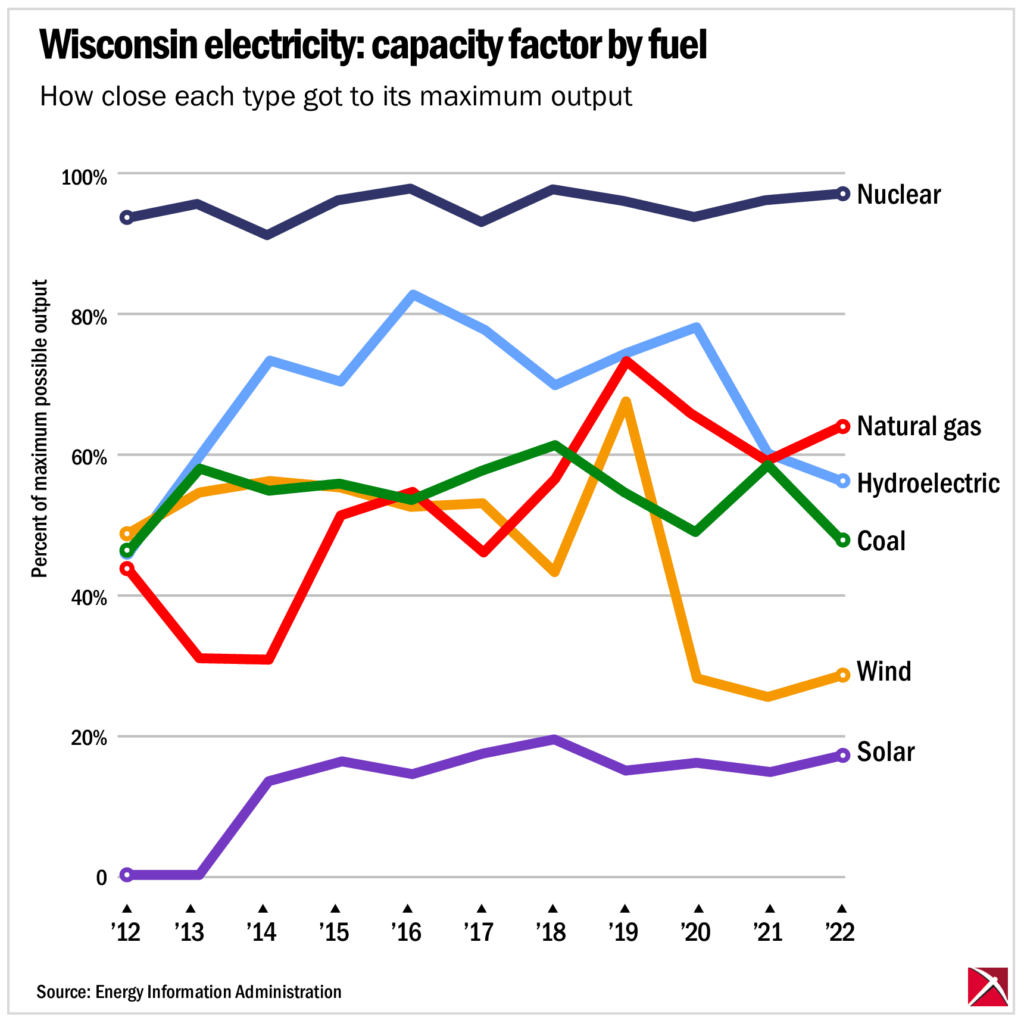
Two related metrics useful in evaluating sources of electricity are generation capacity and capacity factor.
A power plant’s electricity generation capacity is the maximum electric output that it can produce. When you hear of a 300 megawatt solar installation or a 1,300 megawatt coal plant, this is what those numbers refer to.
However, as the U.S. Energy Information Administration explains, generators do not constantly produce electricity. Actual output may vary for a variety of reasons, which means that the maximum rated output is not enough to evaluate a given energy source’s impact on the supply of electricity.
A generator’s capacity factor is a percentage that tells how much of its maximum capacity a power plant actually produced during a given period.

By far, the energy source with the highest capacity factor is nuclear energy. Wisconsin’s one nuclear power plant consistently puts out more than 90% of the maximum amount of power it’s rated for. In 2022, the most recent year for which data are available, the nuclear capacity factor for Wisconsin was 96.2, according to the EIA. As the Badger Institute previously examined in By the Numbers, nuclear power produces around one-fifth of the state’s electricity.
The capacity factor for combined cycle natural gas plants was 63.2%, and for coal, 47.6%. In recent years, natural gas has eclipsed coal as the single largest source of electricity for Wisconsin. Natural gas, like coal or nuclear plants, provides the benefit of being a “dispatchable” source of electricity, meaning that these sources can reliably be called on to meet power demand when needed. Natural gas plants, additionally, can be fired up quickly compared to coal or nuclear plants, making them useful for handling peak demand periods.
For “renewable” sources of electricity, output is limited by patterns outside of operators’ control, such as weather or sunset. Such sources, rather than being dispatchable, are known as “intermittent.” Capacity factors for these sources tend to be lower than gas, coal or nuclear plants. For wind turbines, the capacity factor in Wisconsin last year was 28.2%, and for solar power installations, the capacity factor was only 16.9%. In the EIA’s Wisconsin records, solar energy has never reached a capacity factor above 20%, meaning that solar installations have never produced more than 20% of the power they’re rated to produce.
The low capacity factors of wind and solar generation mean that in practice, it takes many more generators of a given output rating to produce the same amount of energy as a dispatchable source like a nuclear reactor. One MIT analysis found that while the average American nuclear reactor, at 900 Mw, had 300 times the maximum output of the average wind turbine, at 3 Mw, it would actually take 800 such wind turbines to replace the reactor because of the differing capacity factors.
Capacity factors come into play while managing the supply of electricity during periods of high demand. A brief by the Center of the American Experiment, a Minnesota public policy institute, last summer described how wind output cratered at the same time that households needed more electricity to power their air conditioners, with turbines producing only 5.9% of their rated output, far below the expectations of the managers of the upper Midwest’s power grid.
The underlying numbers
| Year | Coal | Natural gas | Hydroelectric | Nuclear | Solar | Wind |
| 2008 | 65.3 | 18.7 | 37.8 | 87.5 | 0 | 49.5 |
| 2009 | 57.3 | 20.4 | 32 | 91.5 | 0 | 27.9 |
| 2010 | 58.3 | 20.3 | 48.7 | 95.7 | 0 | 28.8 |
| 2011 | 55.2 | 23.5 | 62.7 | 79.8 | 0 | 29.8 |
| 2012 | 45.9 | 43.7 | 46 | 93.1 | 0 | 48.2 |
| 2013 | 57.5 | 30.7 | 59.1 | 94.8 | 0 | 54.1 |
| 2014 | 54.3 | 30.6 | 72.7 | 90.4 | 13.6 | 55.7 |
| 2015 | 55.5 | 51.1 | 69.8 | 95.5 | 16.2 | 54.7 |
| 2016 | 53.2 | 54.2 | 81.9 | 96.9 | 14.5 | 52 |
| 2017 | 57.2 | 45.5 | 77 | 92.3 | 17.5 | 52.5 |
| 2018 | 60.9 | 56 | 69.4 | 96.7 | 19.4 | 42.6 |
| 2019 | 54 | 73 | 73.7 | 95.3 | 14.9 | 67 |
| 2020 | 48.3 | 64.9 | 77.5 | 92.9 | 16 | 27.7 |
| 2021 | 58.1 | 58.5 | 59.8 | 95.4 | 14.7 | 25.1 |
| 2022 | 47.6 | 63.2 | 55.9 | 96.2 | 16.9 | 28.2 |
Source: EIA. Natural gas is combined-cycle plants.
Submit a comment
"*" indicates required fields


