By the numbers
Wisconsin’s district-run public schools had $18,592 of revenue per pupil, an all-time high and more than twice what it was in the school year ending in 2000, according to the most recent figures from the Department of Public Instruction.
The figure’s peak status holds even after adjusting for inflation.
In 2023-2024, school districts in Wisconsin took in $15.3 billion in revenue and educated 827,397 students as counted by the DPI for school finance purposes. Dividing one by the other gives a per-pupil revenue figure.

Funding for traditional district-run public schools comes mostly from local property taxes (38 percent statewide in 2023-24), state aid (45 percent), and federal aid (12 percent). Another 5 percent statewide came from other sources, generally payments from other districts for services provided. While the funding combination that each school district receives is unique, the DPI provides data on a district level and aggregated statewide. The statewide calculation sums all statewide revenue and divides it by total statewide public-school membership.
On a statewide basis, revenue per pupil has increased every school year since 1999-2000 with two exceptions: 2011-12 and 2012-13, following the Act 10 labor reforms, in which districts were given wide latitude to reduce benefits costs. The largest single year increase was between 2019-20 and 2020-21, an increase of $1,281 per pupil.
This most recent school year, per-pupil revenue increased $684. Over the past four years, increases have averaged $964 per year.

Even after accounting for inflation, revenues are increasing. The 1999-2000 revenue level was equivalent to $16,339 in 2024 dollars. That climbed to an inflation-adjusted $18,445 in 2010. After Act 10, revenue in 2024-dollar terms decreased to $16,837 per pupil but has generally increased since then.
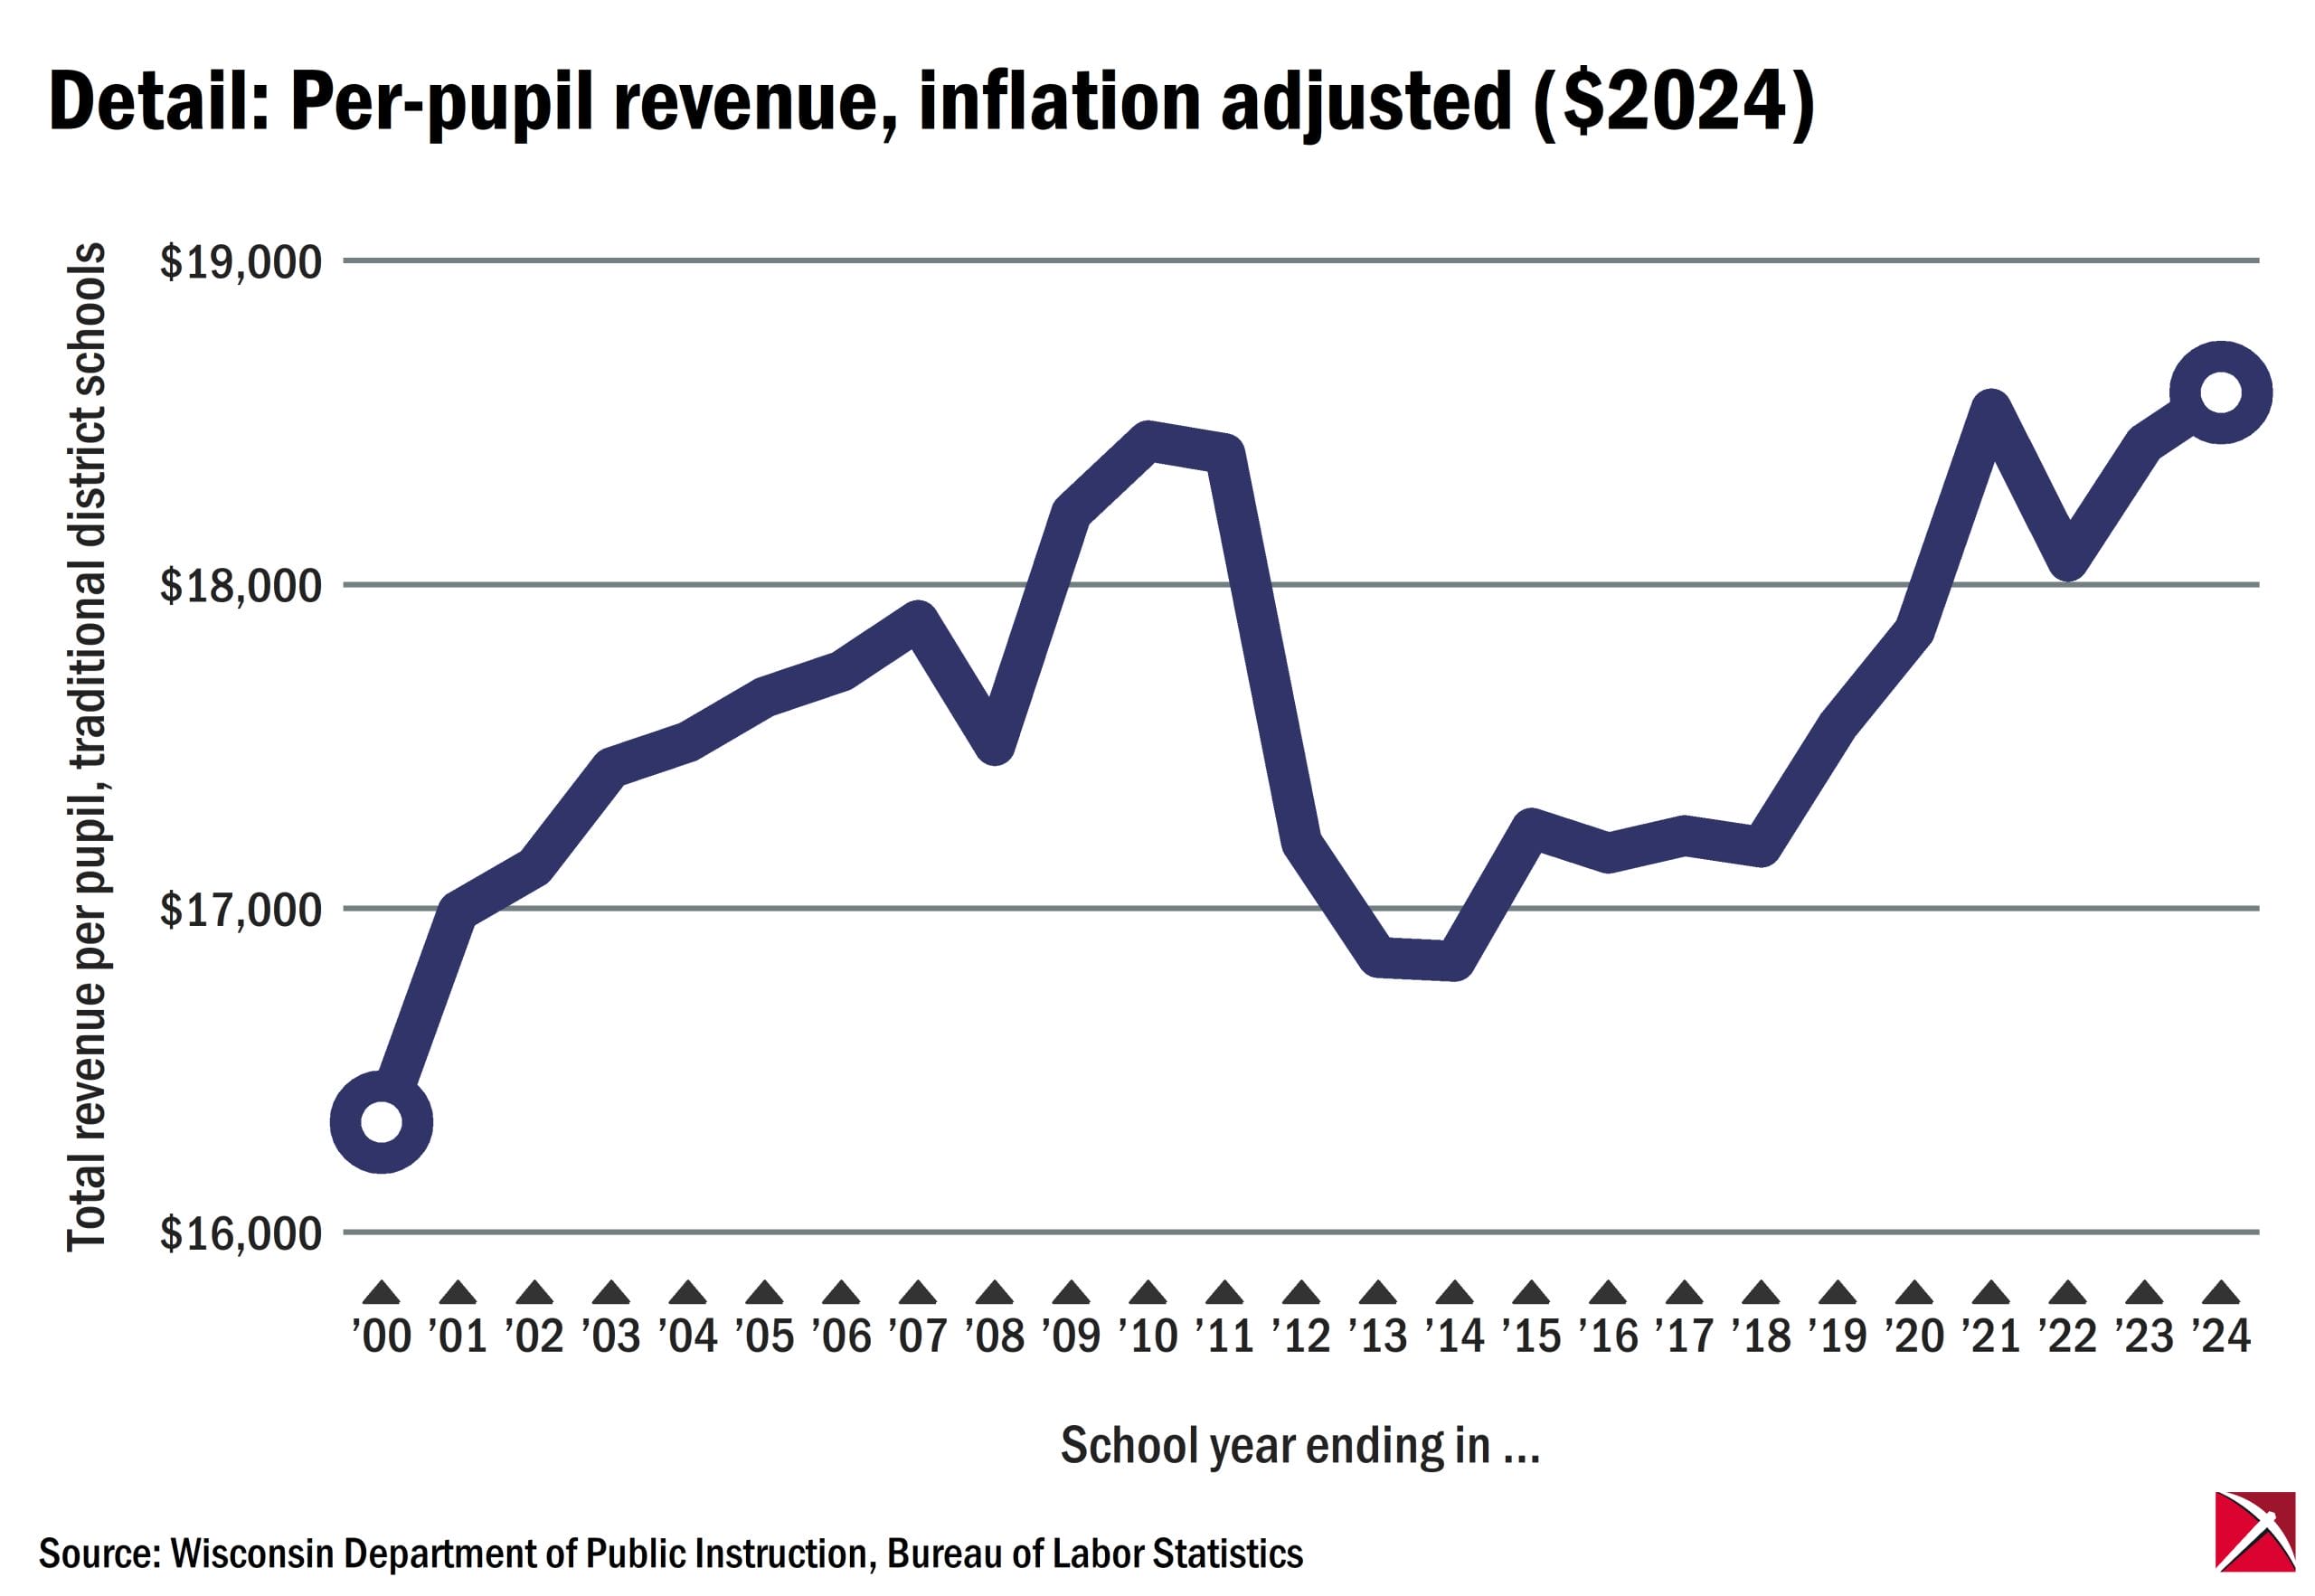
The figure above shows the same series of inflation-adjusted data on a narrower scale for greater detail.
The Badger Institute has previously reported on trends in Wisconsin’s per-pupil spending. The total education cost per member in 2023-24 was $17,400, up 6.5% from $16,345 in 2022-23.
The underlying numbers
| School year ending in | Total statewide district revenue | Membership | Revenue per member | Inflation adjusted revenue per member |
| 2000 | $7,799,869,366 | 869,665 | $8,969 | $16,339.35 |
| 2001 | $8,348,917,221 | 870,608 | $9,590 | $16,991.96 |
| 2002 | $8,567,354,836 | 872,338 | $9,821 | $17,128.64 |
| 2003 | $8,927,737,683 | 872,990 | $10,227 | $17,435.16 |
| 2004 | $9,188,973,621 | 871,214 | $10,547 | $17,514.69 |
| 2005 | $9,548,789,842 | 869,002 | $10,988 | $17,652.69 |
| 2006 | $9,891,226,748 | 868,089 | $11,394 | $17,733.59 |
| 2007 | $10,260,225,007 | 867,699 | $11,825 | $17,889.88 |
| 2008 | $10,364,984,501 | 863,013 | $12,010 | $17,502.94 |
| 2009 | $10,724,431,144 | 860,477 | $12,463 | $18,221.67 |
| 2010 | $11,004,346,749 | 858,205 | $12,823 | $18,444.91 |
| 2011 | $11,312,726,895 | 857,273 | $13,196 | $18,404.57 |
| 2012 | $10,769,142,151 | 855,327 | $12,591 | $17,203.42 |
| 2013 | $10,712,101,621 | 856,147 | $12,512 | $16,848.91 |
| 2014 | $10,885,893,695 | 856,792 | $12,705 | $16,837.38 |
| 2015 | $11,133,065,333 | 854,359 | $13,031 | $17,247.82 |
| 2016 | $11,223,917,255 | 854,363 | $13,137 | $17,170.88 |
| 2017 | $11,511,839,263 | 855,307 | $13,459 | $17,224.78 |
| 2018 | $11,775,239,790 | 855,770 | $13,760 | $17,190.10 |
| 2019 | $12,245,251,490 | 855,332 | $14,316 | $17,566.87 |
| 2020 | $12,592,314,592 | 854,497 | $14,737 | $17,858.66 |
| 2021 | $13,195,391,007 | 823,827 | $16,017 | $18,542.99 |
| 2022 | $14,027,157,407 | 832,029 | $16,859 | $18,073.02 |
| 2023 | $14,882,313,187 | 831,037 | $17,908 | $18,436.70 |
| 2024 | $15,383,242,272 | 827,397 | $18,592 | $18,592.34 |
