By the numbers
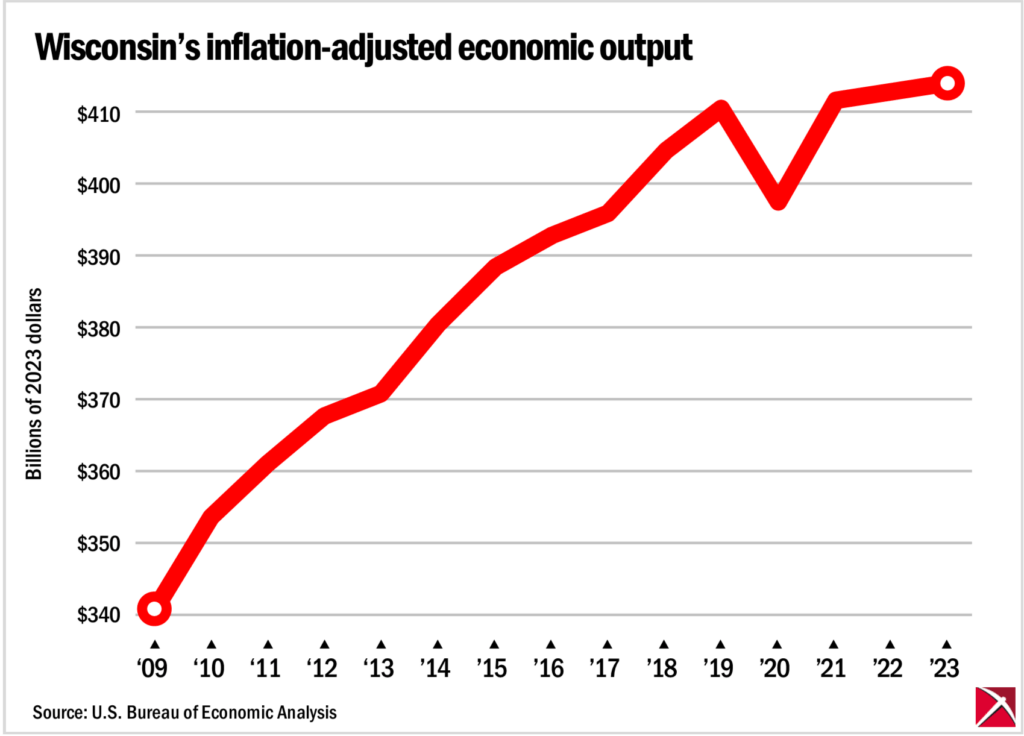
Wisconsin’s economic output has been sluggish since recovering from a pandemic-induced contraction, inflation-adjusted data from the U.S. Bureau of Economic Analysis show.

Year-over-year growth rates in real output were just 0.35% and 0.23% in 2022 and 2023, respectively.
A state’s gross domestic product (GDP) is a measure of all finished goods and services produced within the state’s borders during a specific period of time.
Nominal GDP represents the monetary value of all goods and services at the prices earned when they were produced. However, prices in the U.S. do not remain constant over time. Due to increases in the overall price level known as inflation, changes in nominal GDP do not reflect the true change in underlying output.
To compare GDP levels over time, nominal GDP must be adjusted for inflation, resulting in a state’s real GDP. Real GDP expresses the levels of output from different years in constant-dollar terms.
The U.S. Bureau of Economic Analysis provides estimates of state-level nominal and real GDP.
In nominal GDP, the Wisconsin economy grew from a low point in 2009, following the Great Recession, to a high point in 2019 of $347 billion. Although the economy suffered a setback of about 1% in 2020 due to the COVID pandemic and related lockdown policies, nominal output roared back in 2021 to over $369 billion, and reached nearly $414 billion in 2023.
After adjusting for inflation, real GDP levels tell a different story. While the economy did expand between 2009 and 2019, annual real growth rates were trending downward. The impact of the 2020 lockdowns produced a more striking contraction than nominal figures reflect, with a decrease in real GDP of 3.2%. Post-COVID growth was initially strong at 3.6% in 2021, but since then, real GDP growth has been close to zero.
The Badger Institute previously published a fact sheet summarizing Wisconsin’s economic growth trends in the beginning of 2023.
Scott Niederjohn, a Badger Institute visiting fellow, also highlighted five positive trends in Wisconsin that were the result of free market reforms.
The underlying numbers
(Amounts are provided in millions of dollars)
| Year | Nominal GDP | Real GDP (2023 Dollars) | Real GDP Growth |
| 2009 | $246,324 | $341,153 | – |
| 2010 | $256,160 | $353,916 | 3.74% |
| 2011 | $265,444 | $361,312 | 2.09% |
| 2012 | $276,253 | $367,886 | 1.82% |
| 2013 | $283,791 | $371,015 | 0.85% |
| 2014 | $296,170 | $380,704 | 2.61% |
| 2015 | $308,305 | $388,409 | 2.02% |
| 2016 | $315,420 | $392,819 | 1.14% |
| 2017 | $321,887 | $396,036 | 0.82% |
| 2018 | $335,144 | $404,581 | 2.16% |
| 2019 | $347,399 | $410,569 | 1.48% |
| 2020 | $343,783 | $397,372 | -3.21% |
| 2021 | $369,032 | $411,576 | 3.57% |
| 2022 | $396,209 | $413,017 | 0.35% |
| 2023 | $413,967 | $413,967 | 0.23% |
Submit a comment
"*" indicates required fields


