By the numbers
Homicides, as in other parts of the country, have risen in Wisconsin in recent years. According to figures gathered and published by the FBI, Milwaukee suffers more than half of homicides in Wisconsin in most years, though the city has about one-tenth of the state’s population. This makes Milwaukee’s homicide rate — homicides per 100,000 inhabitants — much higher than the comparable rates for Wisconsin’s next biggest cities, Madison and Green Bay, and the rate for all the rest of the state outside the three largest cities.
Recent work by the Badger Institute on crime in Wisconsin includes:
A detailed look at crime trends in Wisconsin and in Milwaukee by Sean Kennedy as part of the Institute’s 2022 book of policy solutions, “Mandate for Madison.”
An examination by Kennedy of Milwaukee’s crisis in police staffing.
An examination of the causes of Wisconsin’s criminal justice backlog and a look at possible responses, by Jeremiah Mosteller.
A viewpoint by Mike Nichols on one possible solution to this new wave of crime: supporting your local police.
An update by Kennedy of an additional year of Wisconsin crime data.
A look by Nichols at an underlying cause of criminal justice problems.
The numbers


The first graph shows homicide rates in Milwaukee, Madison, Green Bay, and the entire rest of the Wisconsin outside those three cities.
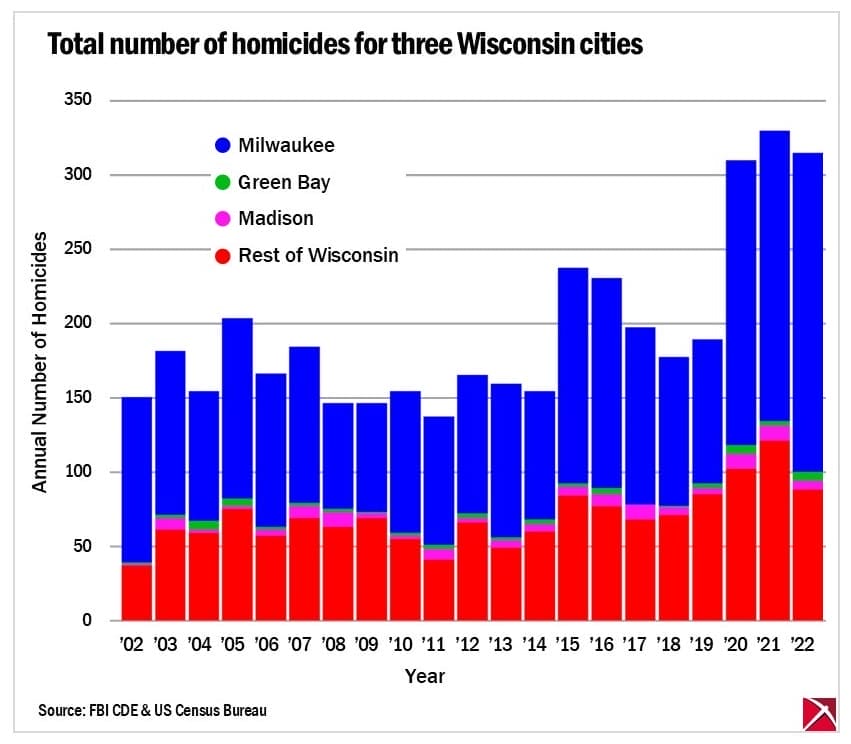
The second graph shows the total number of homicides in Milwaukee, in Madison, in Green Bay and in the rest of Wisconsin. The total height of each column equals the total number of homicides in Wisconsin in a particular year.
The figures on homicides come from the FBI’s Criminal Data Explorer. The years shown here are the most recent available as of the FBI’s annual update in October.
The underlying numbers: Homicides in…
| All Wisconsin | Milwaukee | Madison | Green Bay | Rest of Wisconsin | |
| 2002 | 150 | 111 | 1 | 1 | 37 |
| 2003 | 181 | 110 | 8 | 2 | 61 |
| 2004 | 154 | 87 | 2 | 6 | 59 |
| 2005 | 203 | 121 | 2 | 5 | 75 |
| 2006 | 166 | 103 | 4 | 2 | 57 |
| 2007 | 184 | 105 | 8 | 2 | 69 |
| 2008 | 146 | 71 | 10 | 2 | 63 |
| 2009 | 146 | 73 | 3 | 1 | 69 |
| 2010 | 154 | 95 | 2 | 2 | 55 |
| 2011 | 137 | 86 | 7 | 3 | 41 |
| 2012 | 165 | 93 | 3 | 3 | 66 |
| 2013 | 159 | 103 | 5 | 2 | 49 |
| 2014 | 154 | 86 | 5 | 3 | 60 |
| 2015 | 237 | 145 | 6 | 2 | 84 |
| 2016 | 230 | 141 | 8 | 4 | 77 |
| 2017 | 197 | 119 | 10 | 0 | 68 |
| 2018 | 177 | 100 | 5 | 1 | 71 |
| 2019 | 189 | 97 | 4 | 3 | 85 |
| 2020 | 309 | 191 | 10 | 6 | 102 |
| 2021 | 329 | 195 | 10 | 3 | 121 |
| 2022 | 314 | 214 | 6 | 6 | 88 |
Rate: Homicides per 100,000 inhabitants in…
| All Wisconsin | Milwaukee | Madison | Green Bay | Rest of Wisconsin | |
| 2002 | 2.75 | 18.65 | 0.29 | 0.97 | 0.84 |
| 2003 | 3.30 | 18.51 | 2.28 | 1.93 | 1.38 |
| 2004 | 2.79 | 14.70 | 0.56 | 5.78 | 1.32 |
| 2005 | 3.66 | 20.56 | 0.55 | 4.82 | 1.67 |
| 2006 | 2.98 | 17.56 | 1.07 | 1.93 | 1.26 |
| 2007 | 3.28 | 17.90 | 2.11 | 1.92 | 1.52 |
| 2008 | 2.59 | 12.08 | 2.58 | 1.93 | 1.38 |
| 2009 | 2.58 | 12.33 | 0.76 | 0.96 | 1.51 |
| 2010 | 2.71 | 15.97 | 0.50 | 1.92 | 1.20 |
| 2011 | 2.40 | 14.40 | 1.70 | 2.88 | 0.89 |
| 2012 | 2.88 | 15.54 | 0.71 | 2.87 | 1.44 |
| 2013 | 2.77 | 17.17 | 1.17 | 1.91 | 1.06 |
| 2014 | 2.68 | 14.32 | 1.14 | 2.87 | 1.30 |
| 2015 | 4.11 | 24.15 | 1.35 | 1.91 | 1.82 |
| 2016 | 3.98 | 23.62 | 1.76 | 3.82 | 1.67 |
| 2017 | 3.40 | 20.04 | 2.16 | 0.00 | 1.47 |
| 2018 | 3.05 | 16.91 | 1.06 | 0.95 | 1.53 |
| 2019 | 3.24 | 16.44 | 0.83 | 2.87 | 1.83 |
| 2020 | 5.24 | 33.13 | 2.05 | 5.59 | 2.16 |
| 2021 | 5.60 | 34.46 | 2.02 | 2.82 | 2.57 |
| 2022 | 5.33 | 37.99 | 1.20 | 5.66 | 1.86 |
Correction: An earlier version of this story included an erroneous calculation of the City of Milwaukee homicide rate. While the number of homicides in the city was depicted correctly, the calculation used incorrect population figures for the city, leading to an inaccurately low homicide rate for Milwaukee and an inaccurately high homicide rate for the rest of Wisconsin outside of Milwaukee, Madison and Green Bay. The homicide rate graph is now corrected.
Submit a comment
"*" indicates required fields


