By the numbers
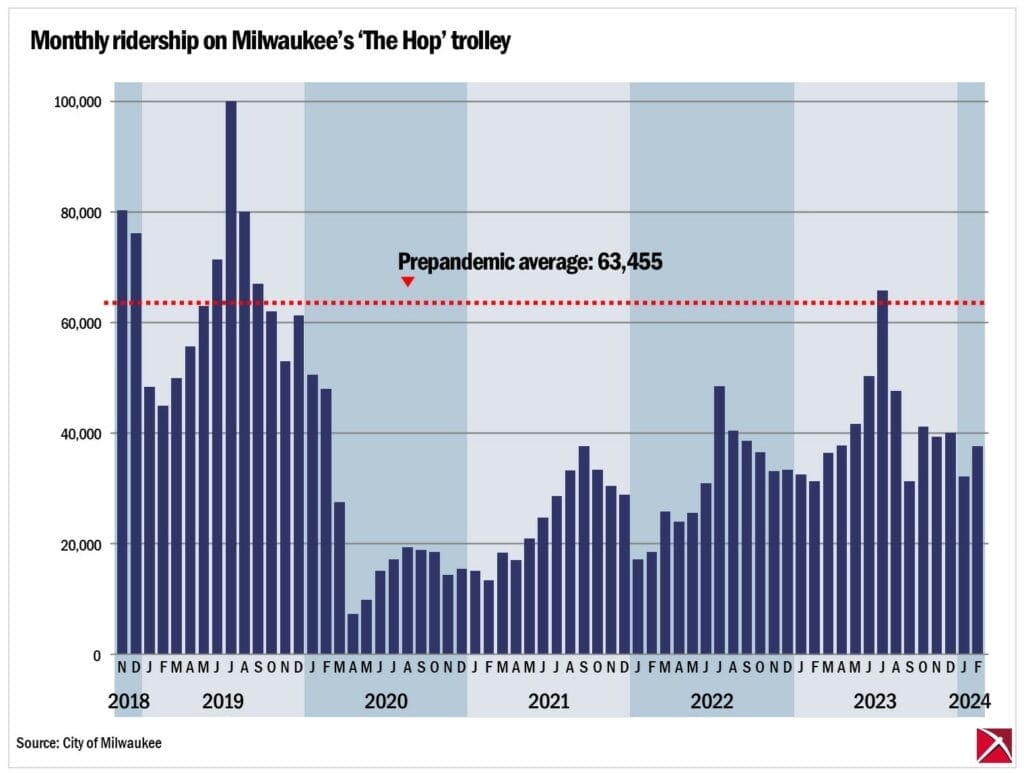
Ridership on Milwaukee’s $128 million fare-free streetcar improved in 2023, when the annual number was 30% higher than 2022.
But the monthly average number of riders over the last 12 months, 41,700, is still about 34% below the pre-pandemic average.

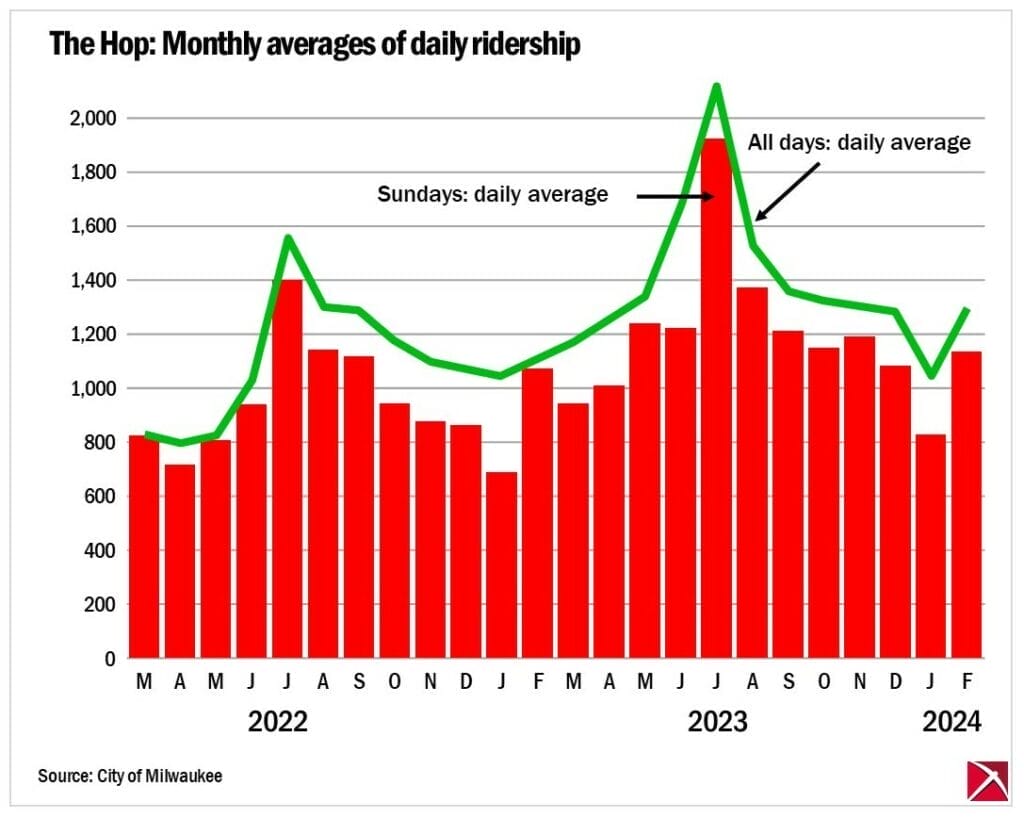
The city’s decision to add a second line last fall, meanwhile, does not appear to have resulted in an appreciable increase in ridership.

In late October, Milwaukee officials began running streetcars on the system’s second line, which runs under the new Couture high-rise near the lakefront — though only on Sundays. Officials claimed the rides are a form of practice for drivers on the new route, but it turned out that the runs to a not-yet-open building fulfilled federal grant requirements.
The graph above depicts, with the red columns, the average Sunday ridership on the streetcars by month. The green line depicts the trend in all-days’ daily ridership.
Previous coverage of the streetcars by the Badger Institute examined the system’s per-rider costs, its effect on taxpayers, the “fiscal anvil” effect on the City of Milwaukee, and claims that it spurred downtown development.
The underling numbers
Average daily ridership on …
| Sundays | All days | |
| Mar-22 | 822 | 834 |
| Apr-22 | 716 | 799 |
| May-22 | 808 | 824 |
| Jun-22 | 938 | 1,030 |
| Jul-22 | 1,400 | 1,562 |
| Aug-22 | 1,141 | 1,301 |
| Sep-22 | 1,118 | 1,287 |
| Oct-22 | 940 | 1,180 |
| Nov-22 | 871 | 1,101 |
| Dec-22 | 859 | 1,076 |
| Jan-23 | 689 | 1,048 |
| Feb-23 | 1,068 | 1,114 |
| Mar-23 | 941 | 1,171 |
| Apr-23 | 1,006 | 1,258 |
| May-23 | 1,234 | 1,343 |
| Jun-23 | 1,219 | 1,676 |
| Jul-23 | 1,920 | 2,121 |
| Aug-23 | 1,371 | 1,534 |
| Sep-23 | 1,209 | 1,359 |
| Oct-23 | 1,145 | 1,328 |
| Nov-23 | 1,187 | 1,308 |
| Dec-23 | 1,078 | 1,286 |
| Jan-24 | 828 | 1,036 |
| Feb-24 | 1,132 | 1,297 |
Submit a comment
"*" indicates required fields


